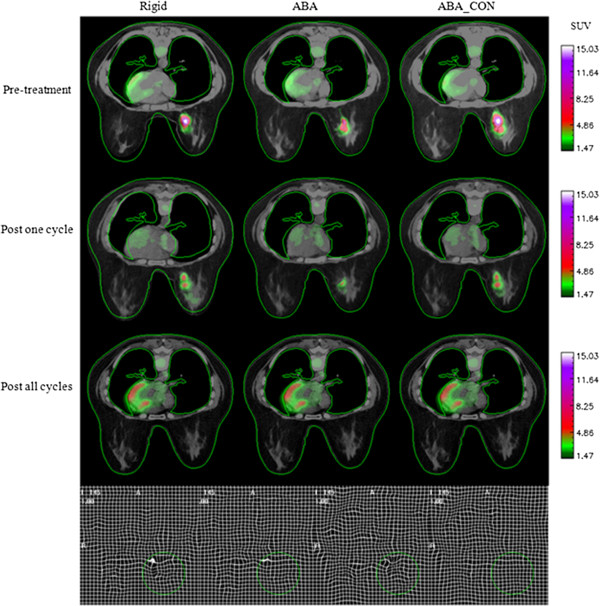
Figure 3.

A representative patient displaying the results of the three registration algorithms. The first three rows correspond to the three time points, and the three columns show the results after rigid body registration, after unconstrained ABA registration (ABA), and with constrained ABA registration (ABA_CON), respectively. In the fourth row, the first panel displays the deformation field generated by the ABA when the images at t1 are registered to the images at t3, while the second panel shows the result using the ABA_CON; the third and fourth panels display similar data when the images at t2 are registered to the images at t3, respectively. The green circle shows the tumor location. The contour of the CT image at t3 is drawn and then copied to other images to facilitate the comparison.
