
Figure 3.
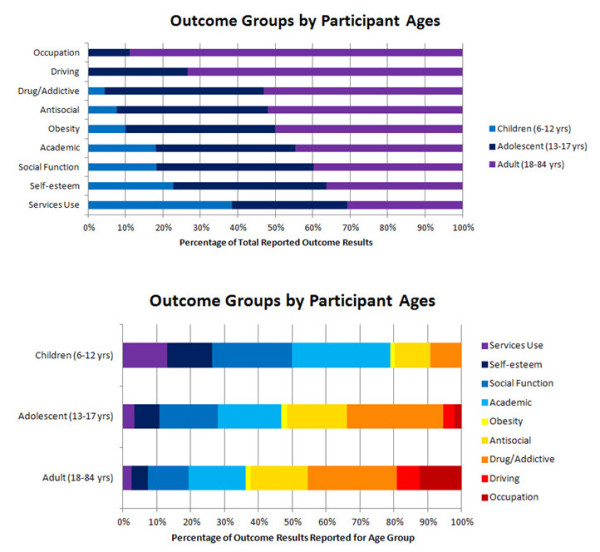
Outcome groups by ages. (A) This graph shows the mid-range/mean ages of the participants measured in studies of specific outcomes. The light blue portion of the bars represent children 6 to 12 years old, the dark blue bars represent adolescents (13 to 17 years) and the violet bars represent adults (18 to 84 years). The greatest proportion of outcomes examined in children can be seen on the bottom (services use), whereas a greater proportion of outcomes examined in adults can be seen on the top (occupation). (B) This graph shows the proportion of outcomes reported within each age category. Each colored section corresponds to the outcomes reported for each outcome group as a proportion of the total number of outcomes reported for that age category.