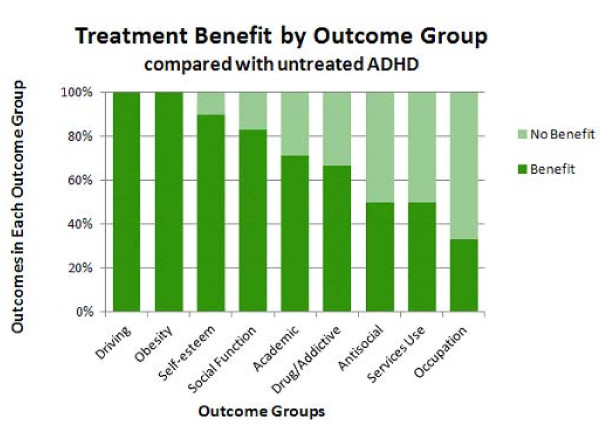
Figure 6.
Benefit and no benefit with treatment by outcome group. This graph shows benefit (dark green bars) or no benefit (light green bars) by outcome group in treated participants with attention deficit hyperactivity disorder (ADHD) versus untreated ADHD. Improvement was reported most often in studies of driving and obesity outcomes (left side), with a greater proportion of outcomes reported to exhibit no benefit following treatment compared with no treatment in studies of occupation (right side). An intermediate proportion of studies of self-esteem, social function, academic, drug use/addictive behavior, antisocial behavior, and services use outcomes reported benefit with treatment.

