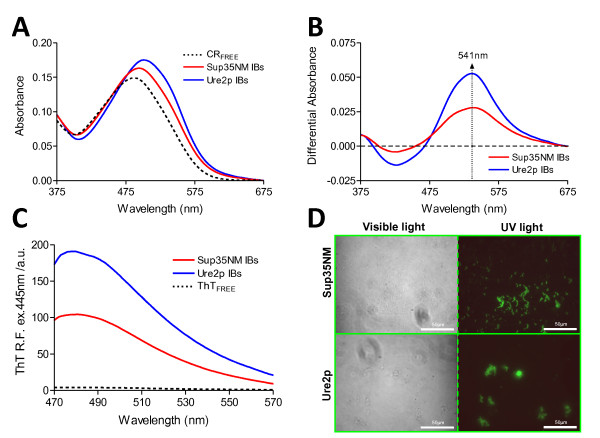
Figure 3.
Specific amyloid dyes staining of yeast prion IBs. (A) CR spectral changes in the presence of each IB; displaying the characteristic red-shift in λmax and intensity increase in CR spectra in the presence of IBs. (B) Difference absorbance spectra of CR in presence and absence of IBs showing the characteristic amyloid band at 541 nm for both yeast proteins. (C) Fluorescence emission spectrum of Th-T in the presence of each IB when excited at 445 nm; note the characteristic maximum at ~ 480 nm upon binding to amyloid structures. (D) Yeast prions IBs stained with Th-S and observed at 40x magnification by phase contrast and fluorescence microscopy displaying the green fluorescence characteristic of amyloid structures.

