
Figure 4.
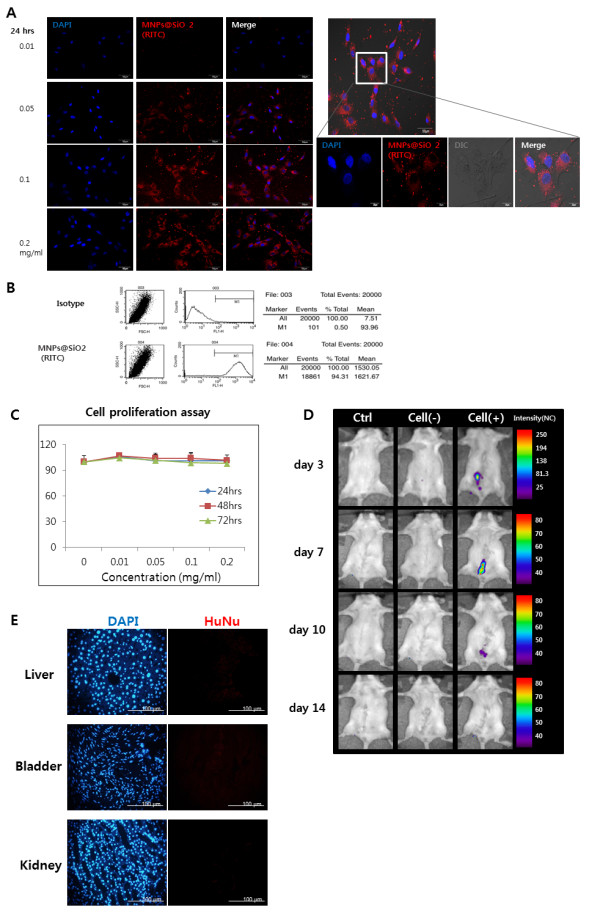
Non-invasive cell tracking of MNPs@SiO2 (RITC) labeled hAFSCs. (A) Fluorescence image of hAFSCs labeled with MNPs@SiO2 (RITC). Following treatment, nanoparticles entered the cytoplasm. The optimum concentration of MNPs@SiO2 (RITC) was 0.1 mg/mL with a treatment time of 24 hours. (B) FACS analysis showed labeling in 94.31% of cells. (C) Cell proliferation assays at various concentrations and exposure times. (D) In vivo cell tracking of nanoparticle-labeled hAFSCs. The cells could be tracked with optical imaging up to 14 days after injection. (E) HuNu was used to monitor hAFSCs migration into other organs. IHC staining revealed no positive expression in the liver, bladder, or kidney.