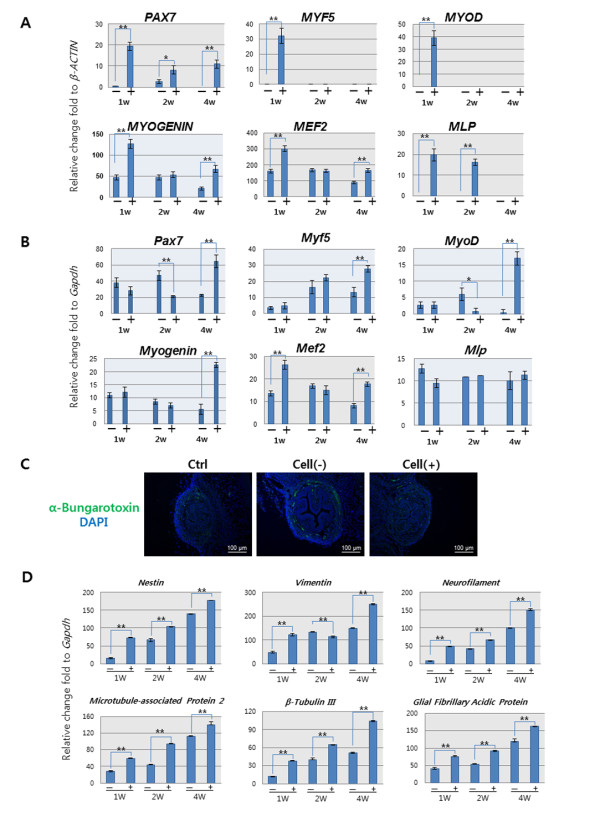
Figure 7.
Real-time PCR analysis of regenerated sphincter. (A) Human gene expression was highest at the first week and gradually decreased with time (**P < 0.01; *P < 0.05). (B) Mouse gene expression was gradually increased with time (**P < 0.01; *P < 0.05). (C) Detection of the neuromuscular junction with α-Bungarotoxin staining. A regenerated neuromuscular junction was detected by the presence of an acetylcholine receptor. (D) Neurogenic marker gene expression was analyzed with real-time PCR. Significantly enhanced gene expression was seen in the cell-injected group compared with the non-injected group (**P < 0.01; *P < 0.05). --, pudendal neurectomy without cell injection; +, pudendal neurectomy with hAFSCs injection

