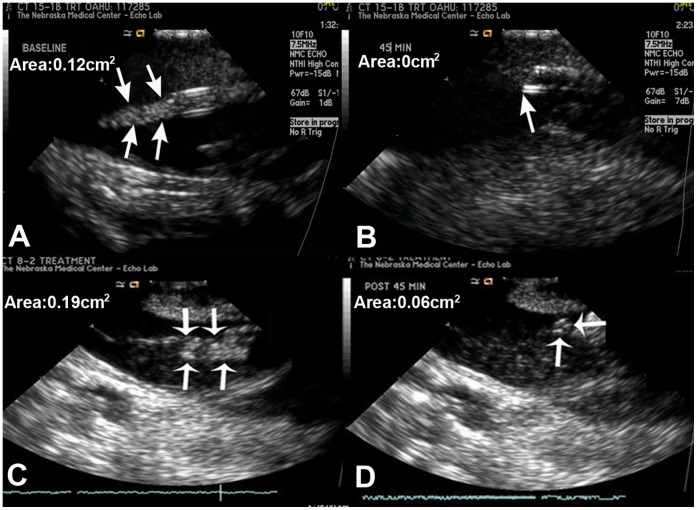
Figure 4. Intracardiac echocardiography before and after treatment.
Examples of intracardiac echocardiographic images of the CVC tip before (panels A, C) and after (panels B, D) long pulse ultrasound and microbubble treatments demonstrating varying grades of thrombus reduction after treatment. Thrombus dissolution was complete (Panel B), near complete (Panel D).

