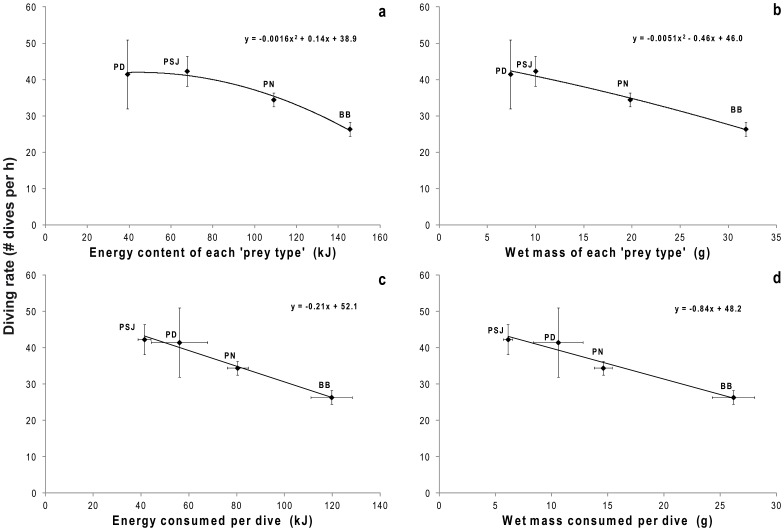
Figure 3. Diving rate in relation to the content and consumption of energy and wet mass per colony according with ‘prey type’.
Relationship between the average diving rate (# dives h−1) per colony and: a) energy content of each ‘prey type’ (kJ), b) wet mass of each ‘prey type’ (g), c) energy consumed per dive (kJ), and d) wet mass consumed per dive (g). Bahía Bustamante (BB), Puerto Deseado (PD), Puerto San Julián (PSJ) and Punta Norte (PN).

