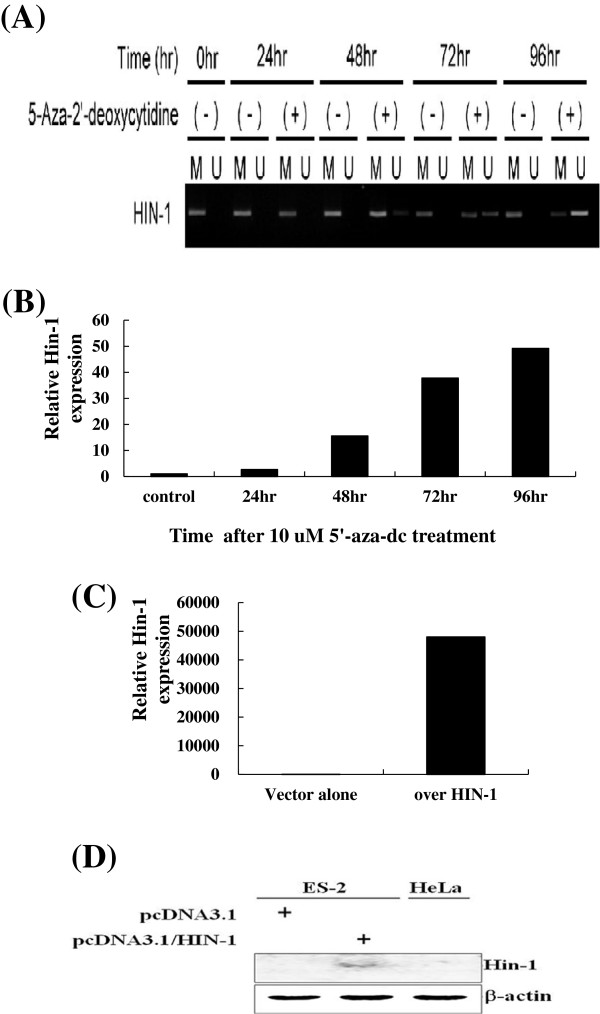
Figure 4.
(A) The representative figure of mRNA expression of HIN-1 in KK cells treated with 5-aza-2-dC at different time intervals. (B) mRNA expression of HIN-1 in KK cells treated with 5-aza-2-dC. After normalization, the relative HIN-1 mRNA level significantly increased in KK cells by 5-aza-2-dC. (C) mRNA levels of ES-2 transfectants. mRNA levels of ES-2 cells transfected with HIN-1 were significantly higher than those of ES-2 transfected with EV (p < 0.0001) (D) HIN-1 protein expression levels of ES-2 transfectants. Protein levels of ES-2 cells transfected with HIN-1 were significantly higher than those of ES-2 transfected with EV (p < 0.0001).

