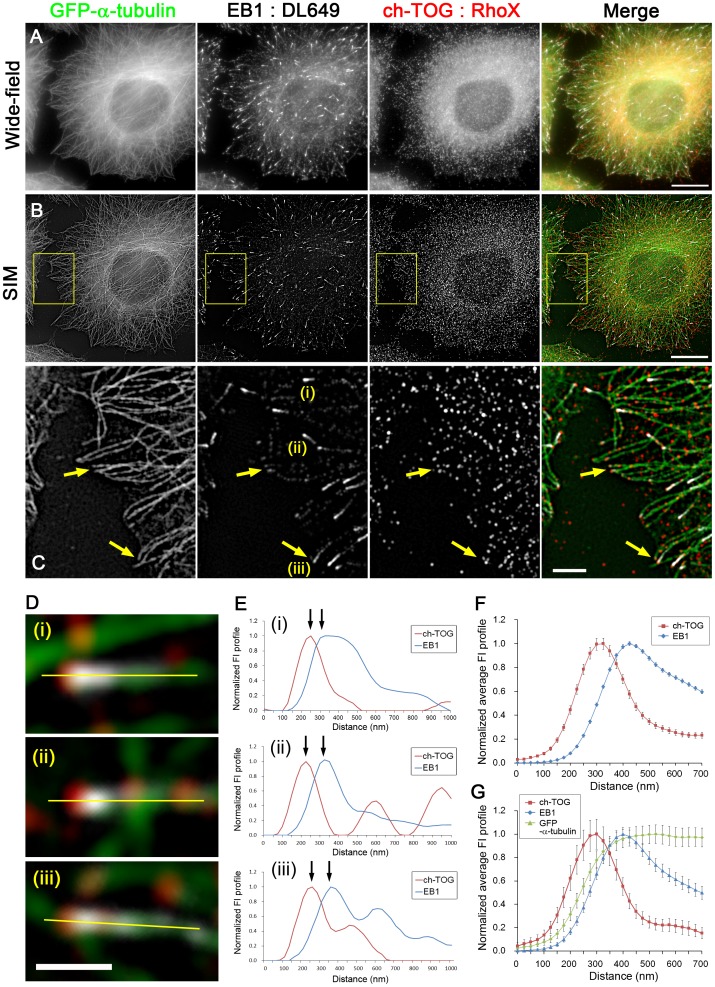
Figure 1. Distributions of EB1 and ch-TOG in HeLa cells.
HeLa/GFP-α-tubulin clones (1E10) were immunostained for EB1 and ch-TOG using DyLight 649 (DL649)- and Rhodamine Red-X (RhoX)-conjugated secondary antibodies, respectively, and visualised by wide-field microscopy (A) and structured illumination microscopy (SIM) (B). The merged images are shown in the right panel, where green indicates GFP-α-tubulin, white indicates EB1 and red indicates ch-TOG. Scale bars, 10 µm. The boxed areas in (B) are enlarged in (C). Note that some of the ch-TOG particles are present at more distal sites than EB1. Yellow arrows indicate microtubule ends stained positively for ch-TOG but negatively for EB1. Scale bar, 2 µm. (D) Enlarged images of the EB1 comets labelled (i)–(iii) in the EB1 panel in (C). Scale bar, 500 nm. (E) Line profiles of fluorescence intensity (FI) plotted from the yellow lines along microtubules indicated in (D). The positions of the peak intensities of EB1 and ch-TOG are separated along the microtubules (arrows). (F) Average FI profiles of EB1 and ch-TOG were obtained by analysing multiple SIM images (n = 330, 8 cells in 4 images) and plotted. The data were normalised and the peak intensities were set to 1. The error bars are SEM. (G) EB1-positive microtubule ends not overlapping with other microtubules were selected and the FI profiles of EB1, ch-TOG and GFP-α-tubulin were averaged (n = 54, 8 cells in 4 images). The values were normalised and the peak intensities were set to 1. The error bars are SEM.

