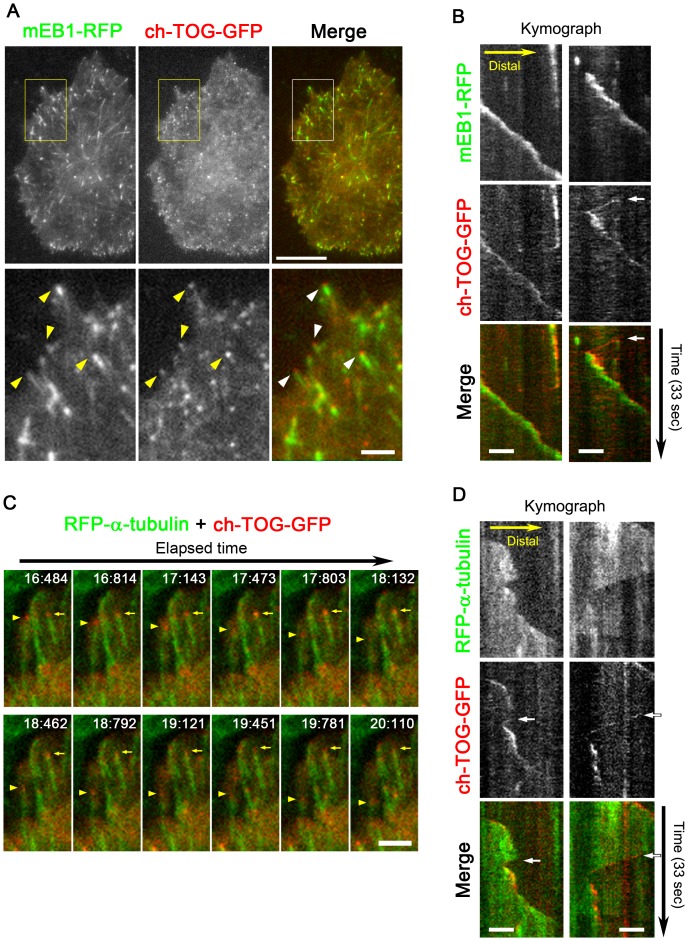
Figure 4. Behaviour of EB1 and ch-TOG in living HeLa cells observed by TIRF microscopy.
(A) The distributions of mEB1-RFP and ch-TOG-GFP in a living HeLa cell. The merged images are shown in the right panel, where green indicates mEB1-RFP and red indicates ch-TOG-GFP. Scale bar, 10 µm. The boxed areas in the upper panels are enlarged in the bottom panels. See also Movie S1, S2. Scale bar, 2 µm. (B) Kymographs showing the movements of ch-TOG-GFP and mEB1-RFP. The kymographs were generated from time-lapse sequences (33-sec long). Two example images are shown. The GFP (red) and RFP (green) signals are merged in the bottom panels. Scale bars, 2 µm. (C) Time-lapse series of part of a movie (Movie S3, S4) showing living HeLa cells expressing RFP-α-tubulin (green) and ch-TOG-GFP (red). Growing and shrinking microtubule ends, with bound ch-TOG-GFP, are indicated by the yellow arrows or arrowheads, respectively. The elapsed time is indicated in the figure as s:ms. Scale bar, 2 µm. (D) Kymographs showing the movements of ch-TOG-GFP and RFP-α-tubulin are presented similarly to in (B). Scale bar, 2 µm. In all figures, GFP and RFP are pseudo-coloured in red and green, respectively, for consistency with the other images. In the kymographs, the ch-TOG-GFP signals were always detected at a position slightly distal to the EB1 signals (B), although fast retrograde movement of ch-TOG-GFP was also observed (arrows in B). Simultaneous visualisation of ch-TOG-GFP and RFP-α-tubulin demonstrated the tracking of shortening microtubule ends by ch-TOG-GFP (arrows in D).

