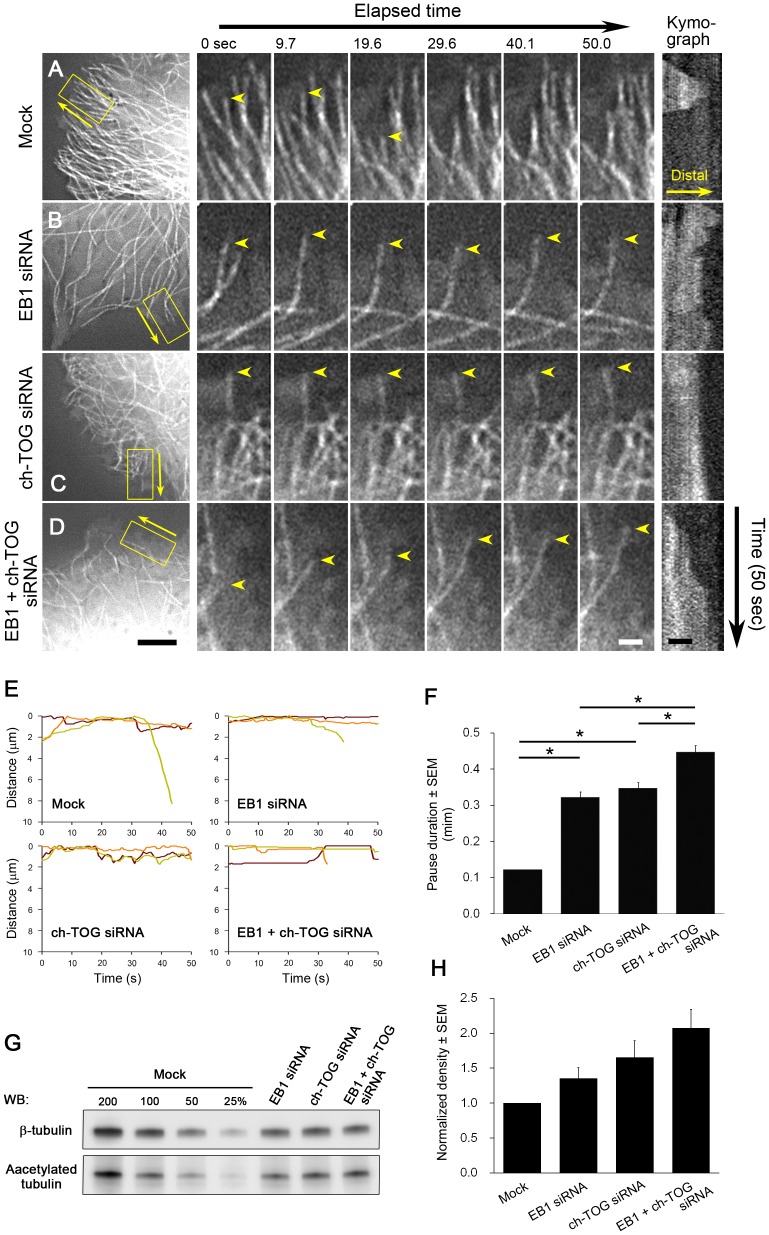
Figure 8. Impact of EB1 and/or ch-TOG depletion on microtubule dynamics in interphase HeLa cells.
(A–F) Analysis of microtubule dynamics by time-lapse imaging of HeLa/GFP-α-tubulin clones (1E10) after transfection with the indicated siRNAs. Because ch-TOG depletion impairs mitosis and induces dell death, siRNA-treated cells were blocked in interphase 24 h after transfection by addition of thymidine (2.5 mM). Cells were imaged with a 0.5 s interval (Movie S5). In A–D, the first frames of the time-lapse movies (left), selected time-lapse images of the boxed areas (middle), and kymographs of the indicated microtubules (arrowheads) are shown (right). The time-lapse images are arranged with the microtubule distal ends upwards (the direction of the arrows in the left panels). Scale bars; 5 µm (left), 1 µm (middle and right). (E) Life-history plots of individual microtubules are shown. Plots for three different MTs are shown by the red, green and orange lines. In (F), the duration time of the “pause” state, in which microtubules exhibit no detectable growth/shortening or repeated growth/shortening within a limited distance (< 1 µm), was measured and plotted. The results are presented as means ± SEM (*, P < 0.01; n = 360 in 15 cells for mock, n = 204 in 15 cells for EB1 siRNA, n = 204 in 15 cells for ch-TOG siRNA, n = 179 in 15 cells for EB1 + ch-TOG siRNA). The pause duration time was increased additively following EB1 and ch-TOG double knockdown. (G, H) Western blotting (WB) analysis for acetylated tubulin, a marker of stable microtubules. In (G), a representative western blot of lysates from cells treated with the indicated siRNAs probed with the indicated antibodies is shown. The average densities of the acetylated tubulin bands obtained from five independent experiments are plotted in (H). The data were normalised and the density of the mock control was set as 1. The results are presented as means ± SEM (P = 0.061 for mock v.s. EB1 siRNA, P = 0.034 for mock v.s. ch-TOG siRNA, P = 0.006 for mock v.s. EB1+ch-TOG siRNA, P = 0.317 for EB1 siRNA v.s. ch-TOG siRNA, P = 0.042 for EB1 siRNA v.s. EB1+ch-TOG siRNA, P = 264 for ch-TOG siRNA v.s. EB1+ch-TOG siRNA; n = 7). For WB full scans, see also Figure S6A.

