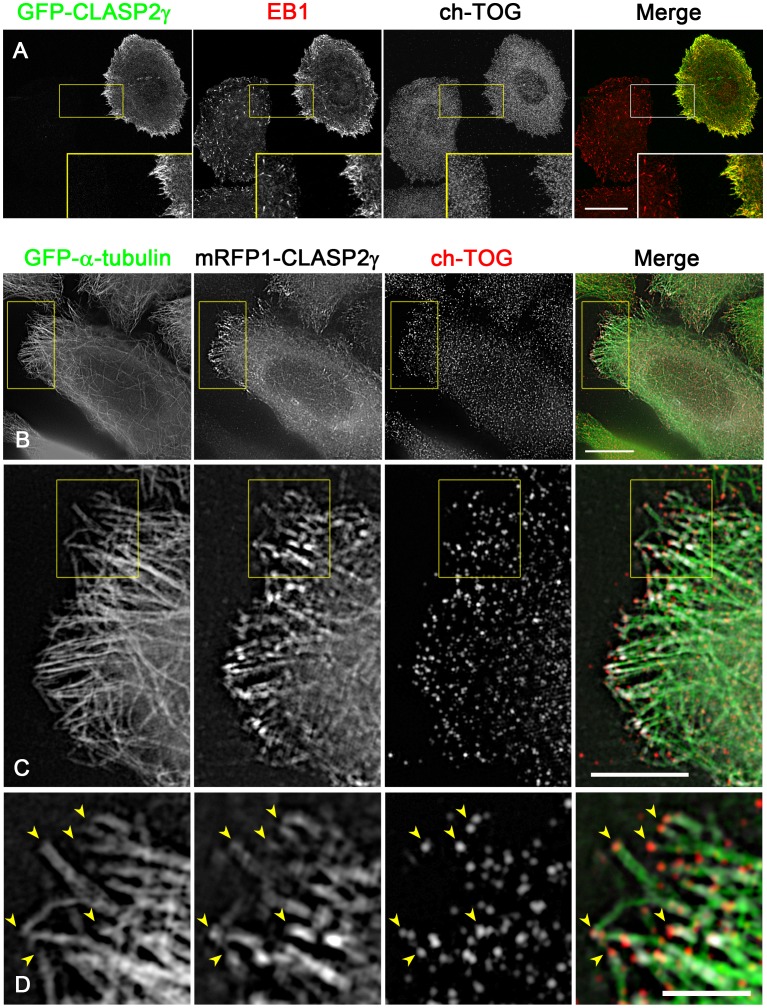
Figure 10. EB1, but not ch-TOG, is recruited to CLASP-accumulating microtubule ends.
(A) GFP-CLASP2γ was expressed in HeLa cells, and the cells were fixed and stained for endogenous EB1 and ch-TOG. The images were acquired by confocal microscopy. The GFP-CLASP2γ (green) and EB1 (red) signals are merged in the right panel. The insets show the boxed areas at 2× magnification. Note that only EB1, and not ch-TOG, was recruited to the GFP-CLASP2γ-accumulating microtubule ends. Scale bar, 20 µm. (B–D) mRFP1-CLASP2γ (white) was expressed in HeLa cell clones (1E10) expressing GFP-α-tubulin (green), and the cells were fixed and stained for endogenous ch-TOG (red). The images are merged in the right panel. The images were acquired by SIM. In the bottom panels, the boxed areas in the upper panels are magnified. Boxed areas in (B) and (C) are enlarged in (C) and (D), respectively. Note that ch-TOG distributes at the most distal portion of microtubule ends even after mRFP1-CLASP2γ overexpression. Scale bars, 10 µm (B, upper), 2 µm (B, bottom), 500 nm (C).

