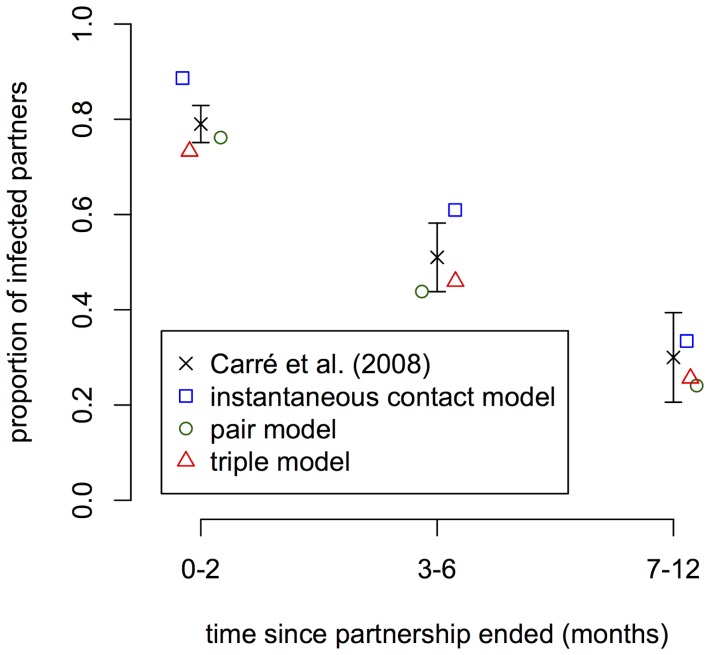
Figure 3. Simulated and empirical data of C. trachomatis-positivity in partners of index cases.
Black crosses correspond to published data of the proportion of positive partners out of those with a positive test results together with the 95% CI [14]. The other symbols represent simulated data for each of the three different models. In the simulations, it is assumed that the steady-state prevalence of C. trachomatis is 3%. Means of 100 simulation runs are shown. Standard errors are small and omitted for better visibility.

