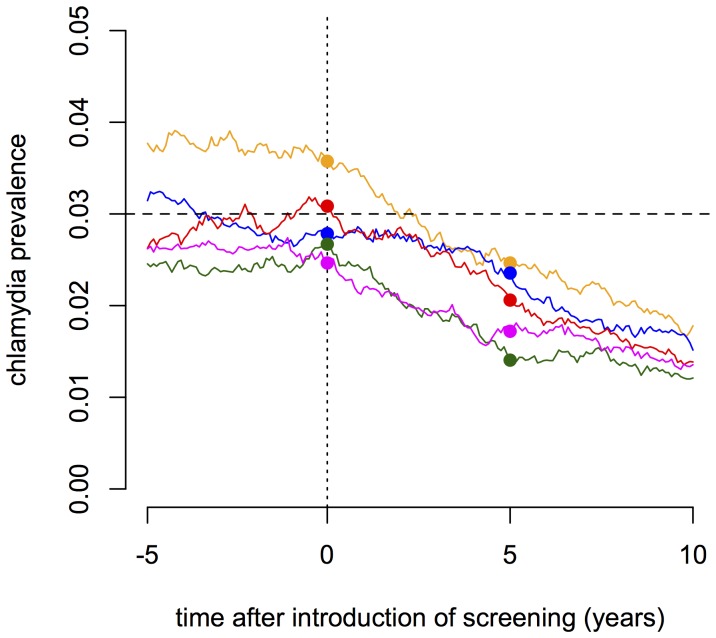
Figure 5. Representative time plots of the prevalence of C. trachomatis after the start of a screening intervention.
The dots indicate the prevalence at the beginning (dotted line) and after 5 years of the screening intervention. The dashed line indicates the steady-state prevalence of 3% in absence of screening. Every individual receives screening at a rate of 0.1 per year and no partner notification is performed. The colored lines represent five individual simulation runs.

