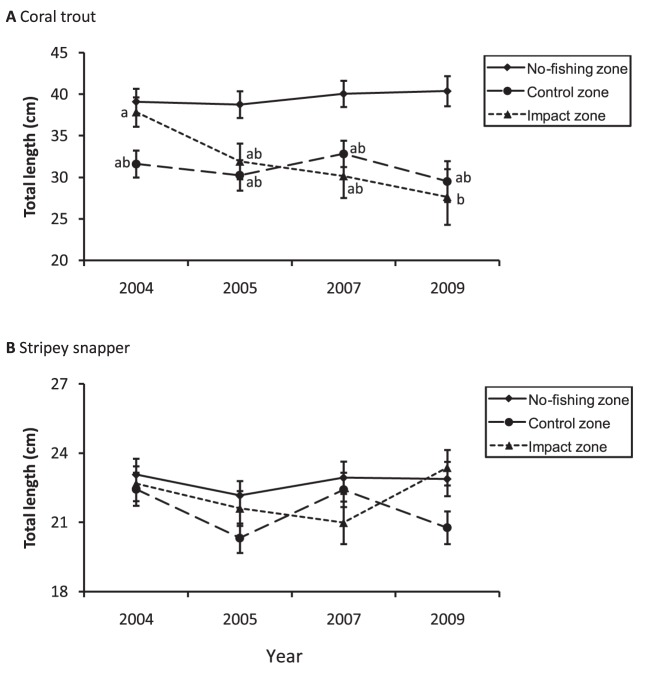
Figure 4. Mean total length (±1SE) of coral trout (A) and stripey snapper (B) from 2004 to 2009.
Data for the no-fishing zone are shown only for the purpose of comparison. The management history of each zone is described in Figure 2. Sample sizes for control, impact and no-fishing zones were 40–62, 17–68 and 53–94 respectively. Data originate from 40 underwater visual transects per zone per year. Groups with the same letters were not significantly different.

