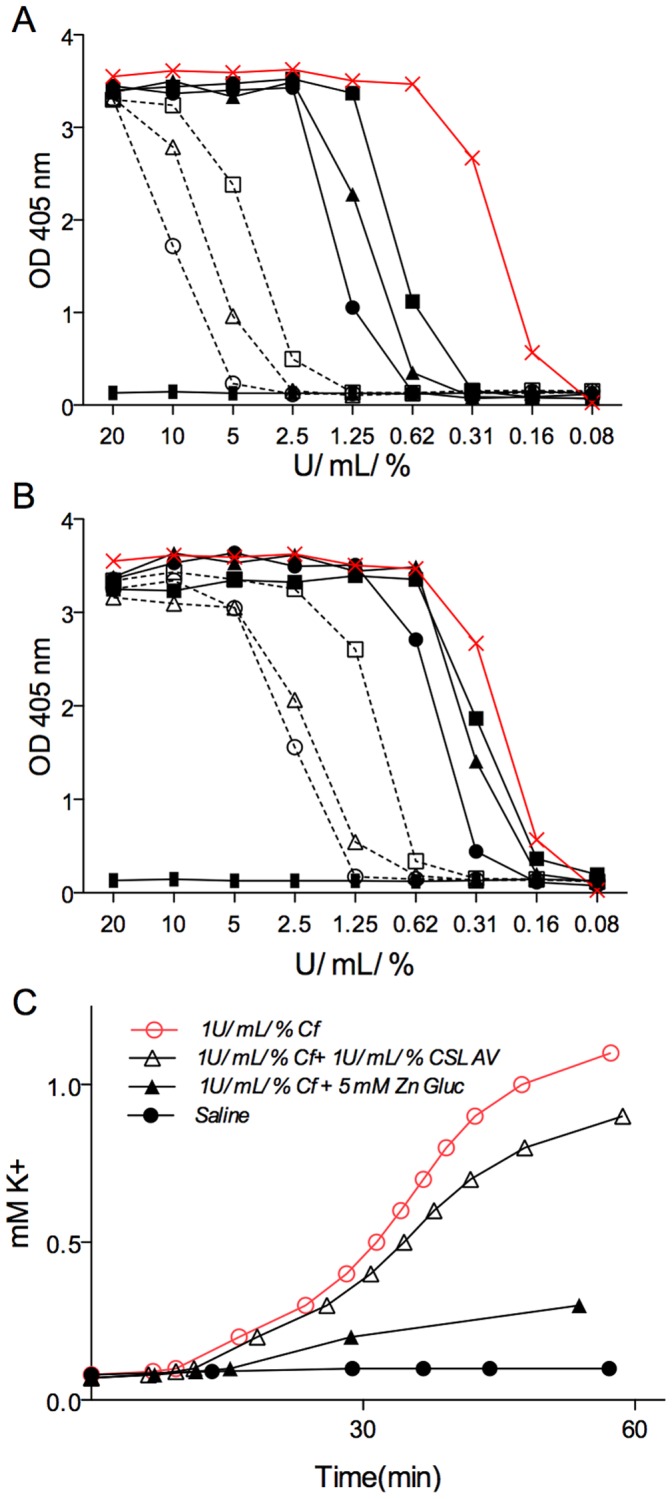
Figure 6. Inhibitory effects of zinc gluconate compared to CSL antivenom in Chironex fleckeri exposed human RBC.

Hemoglobin release was measured over (A) a concentration range of venom in the presence of high concentration potential inhibitors: 50 mM zinc gluconate (open circle), 25 mM zinc gluconate (open triangle), 12.5 mM zinc gluconate (open square), and 250 U/mL/% CSL antivenom (closed circle), 125 U/mL/% CSL antivenom (closed triangle), 62.5 U/mL/% CSL antivenom (closed square) or saline (red×marks). (B) Hemoglobin release was measured over a concentration range of venom in the presence of therapeutically relevant concentration range of zinc gluconate and antivenom 6.25 mM zinc gluconate (open circle), 3.25 mM zinc gluconate (open triangle), 1.56 mM zinc gluconate (open square), and 31.2 U/mL/% CSL antivenom (closed circle), 15.6 U/mL/% CSL antivenom (closed triangle), 7.8 U/mL/% CSL antivenom (closed square) or saline (red×marks). (C) Time course release of potassium from RBC was measured in the presence of saline (closed circle), 1 U/mL/% Chironex fleckeri venom (open red circle), venom together with 1 U/mL/% CSL antivenom (open black triangle), or venom with 5 mM zinc gluconate (closed black triangle).
