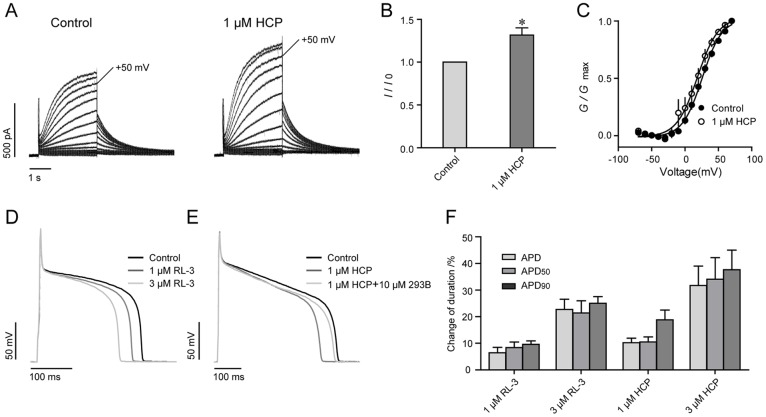
Figure 5. Effects of HCP on the action potential recorded in cardiomyocytes.
A. Representative traces of IKs before and after application of 1μM HCP. To elicit the IKs, a series of depolarization steps from −70 mV to +70 mV in 10 mV increments were applied. B. Effects of 1 μM HCP on amplitude of IKs measured at +50 mV. * p<0.05 versus control. C. G-V curves of IKs. D. Effects of R-L3 on action potentials. E. Effects of HCP on action potentials. Chromonal 293B (10 μM) was co-applied with 1 μM HCP after steady state inhibition. F. Histograms show the change of action potential duration after application of R-L3 and HCP.

