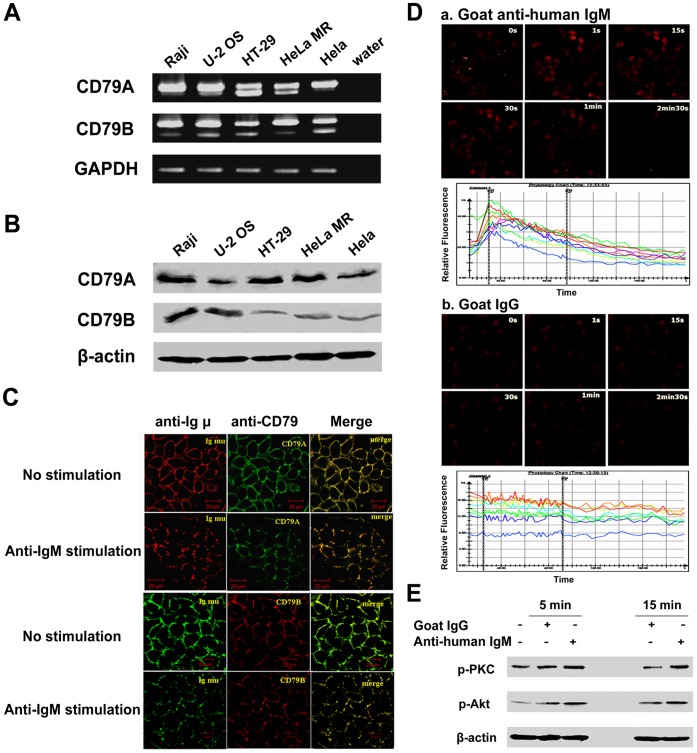
Figure 4. Expression of BCR-like complex in human epithelial cancer cells.
A, RT-PCR showed that CD79A and CD79B were detected in human cancer cell lines, U-2 OS, HT-29, HeLa MR and HeLa, and that there were two isoforms for both CD79A and CD79B. Raji, as positive control; GAPDH, internal control. The PCR products were separated by gel electrophoresis on 1% agarose and were further confirmed by DNA sequencing. B, Western blot analysis demonstrated the presence of the larger isoform of CD79A and CD79B. β-actin, internal control. C, confocal microscopy analysis demonstrated co-localization (yellow) of CD79A (FITC, green) and Ig M (PerCP/Cy5.5, red) (upper two panels), or CD79B (PE, red) and Ig M (FITC, green) (lower two panels) in HeLa MR cells with or without stimulation with anti-IgM. D, calcium flux analysis by confocal microscopy in HeLa MR cells loaded with Fluo-3/AM and stimulated with goat anti-human IgM (a) or goat IgG as isotype controle (b). Images were captured after stimulation for 0, 1, 15, 30, 60, and 150 seconds. The corresponding time course of the calcium flux is shown. The relative fluorescence from the images was estimated with Leica confocal software. Each line represents the signal derived from a single cell. E, phosphorylation of PKC and Akt downstream of the PLC-γ2 and PI3K signaling pathways, respectively, was detected in HeLa MR cells after stimulation with 20 µg/ml goat anti-human IgM for 5 and 15 minutes, respectively.

