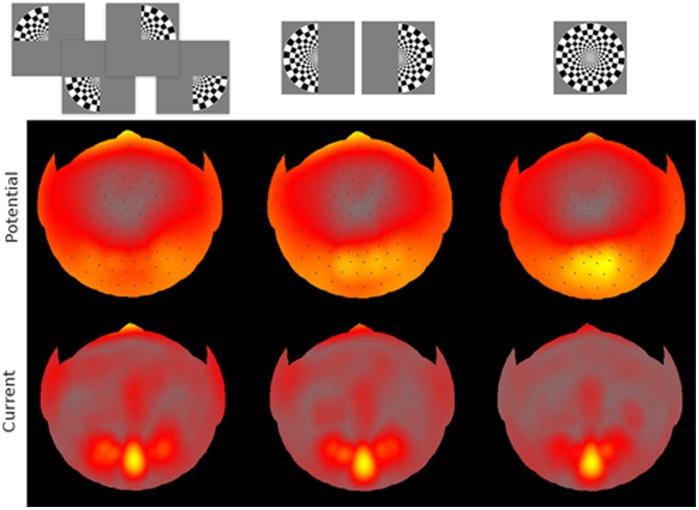
Figure 4. Maximal amplitudes of scalp VEPs (top) and skull-scalp currents (bottom) averaged across subjects.
The maximum activity distributions are shown on flattened scalp surface. Dark dots on the scalp surface indicate electrode locations. The top (North) of each surface map corresponds to nasion, the bottom (South) – to the occipital pole area. Colormaps are not on the same scale across the panels, instead each panel’s scale was set to its full range of amplitude variation. The ranges were (for panels from left to right) 9.8, 5.9, 3.7  for scalp potentials, and 10.9, 7.8, 6.1
  for skull-scalp current densities.

