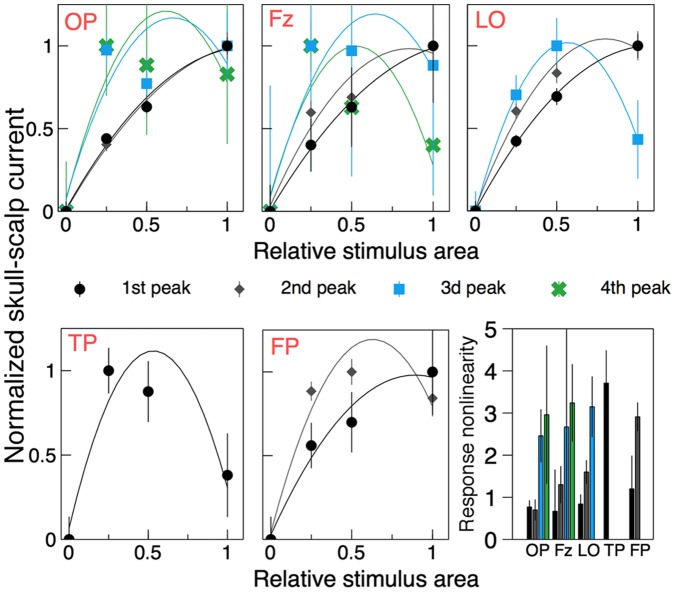
Figure 6. Amplitudes of the skull-scalp current peaks (normalized values) as a function of the relative stimulus area.
Data for peaks of different latencies are shown with different colors, the corresponding peaks are shown in Figure 5 by arrows of the same color. Solid curves show quadratic polynomial fits to the data. The response nonlinearity measure,  , is plotted in the bottom right panel for all peaks.

