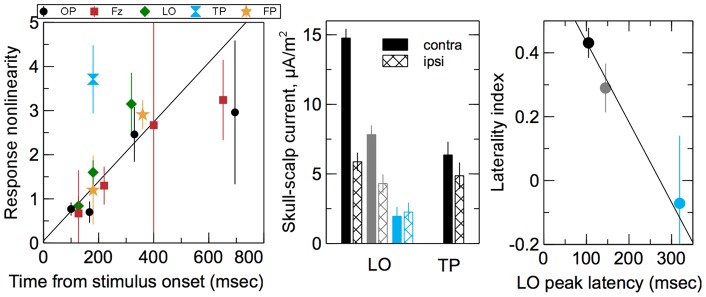
Figure 7. Left: Response nonlinearity shown in the last panel in Figure 6 plotted as a function of the time from the stimulus onset for the corresponding peaks.
The solid line shows a linear fit to the data compounded over all ROIs except TP. Middle: amplitudes of the three LO peaks and the TP peak compared between contralateral (solid bars) and ipsilateral (hashed bars) stimulation. The bars are color coded by the same colors as the respective peaks in Figure 5. Right: the laterality index for the three LO peaks plotted as a function of the peak latency. The solid line shows a linear fit to the data.

