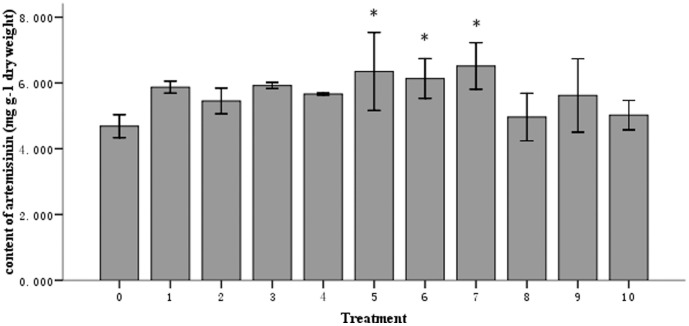
Figure 4. Artemisinin content in A. annua plants grown for 74 days after YIM 63111 inoculation compared with untreated plants (No. 0).
Nos. 1–10 indicate the seedlings that were inoculated with serially diluted bacterial suspensions:  1.84×10⁹,
  3.68×10⁸,
  7.38×10⁷,
  1.48×10⁷,
  2.96×10⁶,
  5.90×10⁵,
  1.18×10⁵,
  2.36×10⁴,
  4.72×10³ and
  900∼1.0×10³ CFU ml−1. * indicates a significant difference (P<0.05, and the error bars represent the standard deviation.

