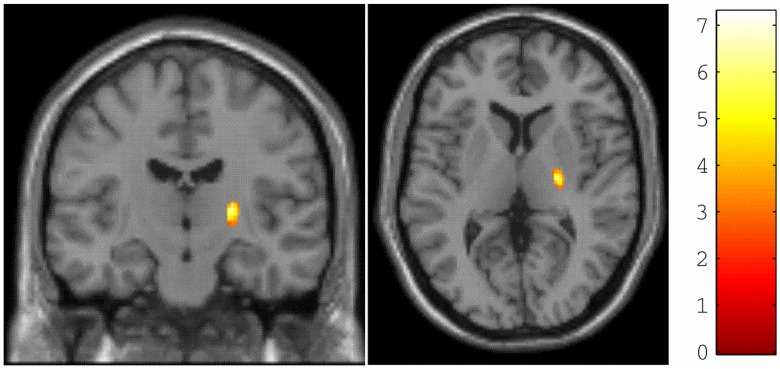
Figure 4. Statistical parametric maps (thresholded at p<0.01, uncorrected for display purposes only) showing the right internal capsule, in which changes in cranial FA of the corticospinal tract (CST) are more sensitive to spinal changes in FA of the mean CST compared with normal variability.
The colour bar represents the t-value.

