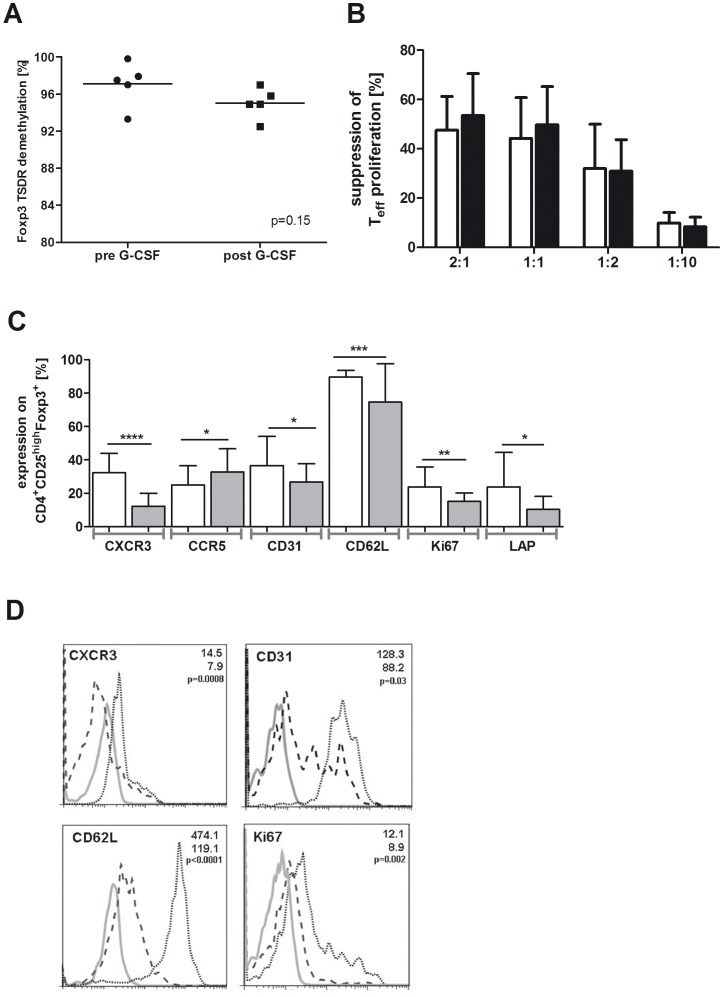
Figure 2. Analysis of donor Tregs before and after SC mobilization: Stability, suppressive function and phenotype.
(A) Quantification of the TSDR demethylation levels of the foxp3 promoter in freshly FACS isolated CD4+CD25highCD127− Tregs before (pre, n = 5) and after (post, n = 5) G-CSF mobilization. (B) Suppressive capacity of freshly FACS isolated CD4+CD25highCD127− Tregs before (pre, n = 5, white bars) and after (post, n = 5, black bars) G-CSF mobilization on the proliferation of autologous CD4+CD25− T cells stimulated with anti-CD3 and anti-CD28 in the presence of irradiated allogeneic PBMCs. Ratio of Treg cells to CD4+CD25− T effector cells is 2∶1, 1∶1, 1∶2 and 1∶10. Percentages of suppression were calculated as indicated in Material and Methods and presented as mean values with standard deviation (SD). (C) PBMCs were isolated before (pre, n = 25, white bars) and after (post, n = 21, grey bars) G-CSF induced stem cell mobilization for FACS analyses. Expression values were calculated as percentage of CD4+CD25highCD127−Foxp3+ Tregs and are presented as mean values with SD (error bars). (D) In addition mean fluorescence intensities (MFI) were determined and representative overlays from histogram plots are shown for candidates with significant expression differences. Spotted black lines represent pre G-CSF and dashed black lines indicate post G-CSF. Grey lines show the respective isotype control.

