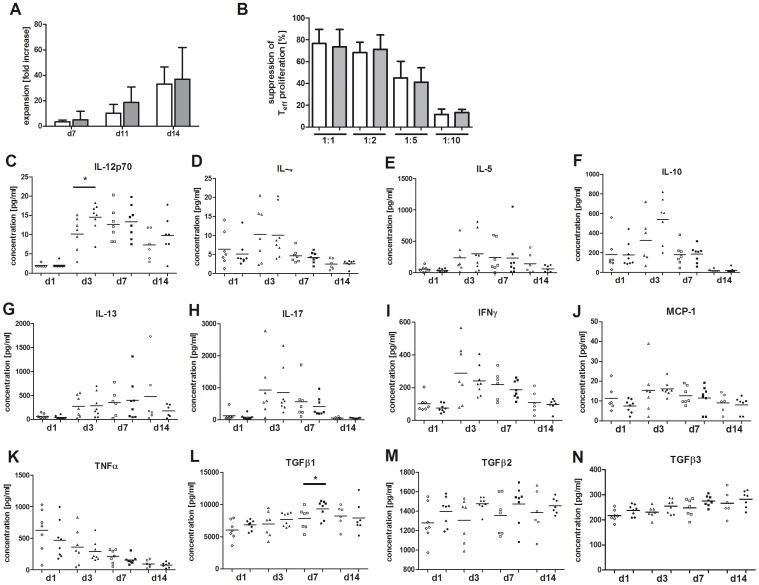
Figure 5. Analysis of donor Tregs before and after SC mobilization: Expansion capacity and cytokine profile.
(A) Expansion capacity is shown as increase of cell counts with fold change after 7, 11 and 14 days of in vitro stimulation with anti-CD3/−CD28 Dynabeads and 500 U/ml IL2. Data are presented for CD4+CD25highCD127− Tregs isolated before (n = 8; white bars) and after (n = 11; grey bars) G-CSF mobilization as mean values. Error bars represent SD. (B) Suppressive capacity of in vitro expanded CD4+CD25highCD127− Tregs before (pre, n = 4, white bars) and after (post, n = 4, grey bars) G-CSF induced SC mobilization on the proliferation of autologous CD4+CD25− T cells. Ratio of Treg cells to CD4+CD25− T effector cells is 1∶1, 1∶2 and 1∶10. Percentages of suppression were calculated as indicated in Material and Methods and presented as mean values with standard deviation (SD). (C–N) Supernatants from ex vivo cultured CD4+CD25highCD127− Tregs (open symbols: before G-CSF application; closed symbols: after G-CSF application) were collected on day 1 (diamonds), 3 (triangles), 7 (squares) and 14 (circles) and comparatively analyzed for the secretion of Th1, Th2, pro – and anti-inflammatory cytokines (see Material and Methods).

