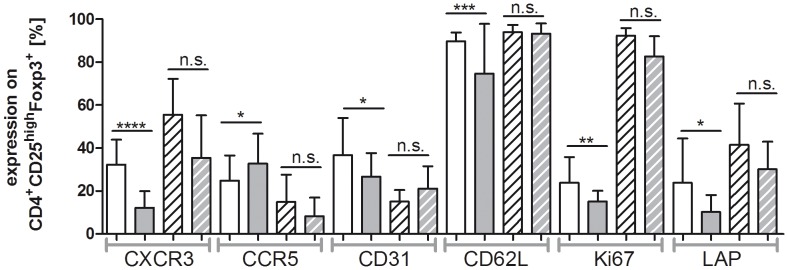
Figure 6. Phenotypic analysis of in vitro expanded donor Tregs before and after SC mobilization.
PBMCs were isolated before (n = 25) and after (n = 21) G-CSF mobilization. FACS isolated CD4+CD25highCD127−Foxp3+ donor Tregs were expanded ex vivo for 14 days. FACS analysis was performed before (white bars) and after (grey bars) SC mobilization as well as after in vitro expansion of donor Tregs isolated before (white with black stripes) and after (grey with white stripes) SC mobilization. Expression values were calculated as percentage of CD4+CD25highCD127−Foxp3+ Tregs and their mean values are presented as bar graphs with SD as error bars.

