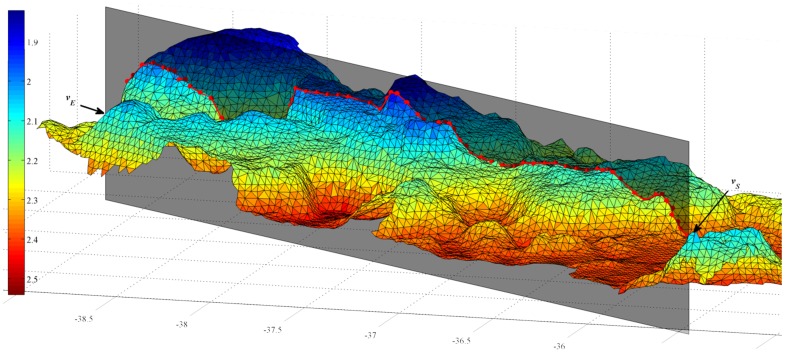
Figure 3. Example of a virtual chain ‘draped’ over a 3D terrain reconstruction.
The coloured surface represents the terrain to be examined. The horizontal axis shows Easting (metres) and the colour bar shows depth (metres). The shaded grey plane represents the plane on which the linear rugosity will be measured while the red line and dots represent the ‘chain’, which is made up of those points that fall within a distance of  from the plane. The points
  and
and  show the start and end verticies of the virtual chain.

