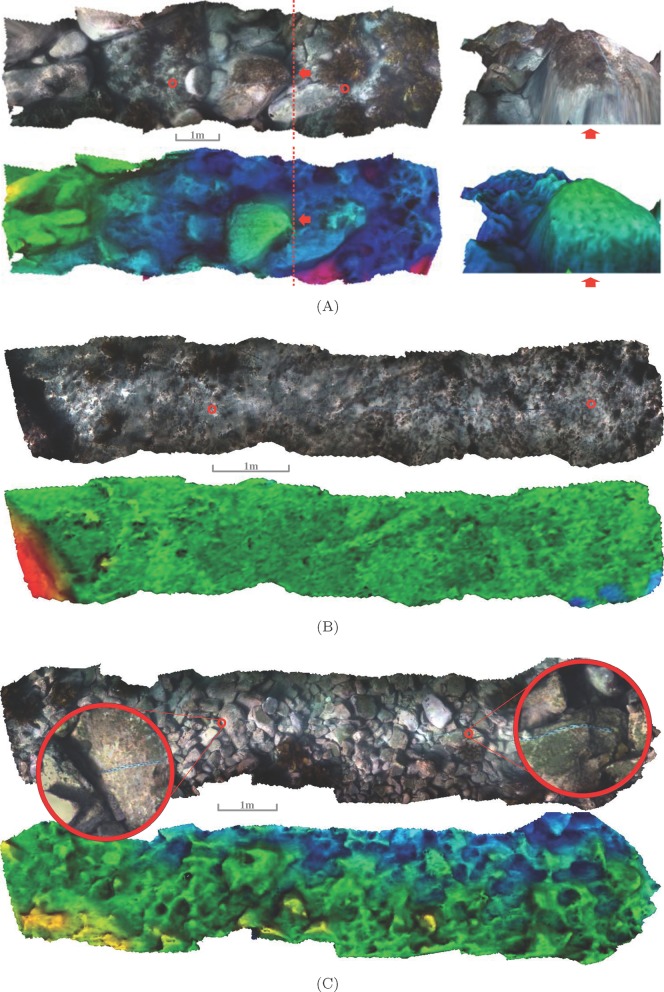
Figure 4. Example survey transects showing different bottom types.
The figures show the photo-realistic 3D mosaic and also the depth mapped bathymetry for each transect. The small red circles show the start and end points of the chain ( ) that was laid out over the terrain. (A) shows a highly rugged patch (
 ,
,  ). It also shows the same patch from an oblique perspective. (B) shows a relatively flat patch (
 ,
,  ) and (C) shows a patch with medium relief (
 ,
,  ). There is also a zoomed in view of the start and end of the chain shown in (C).

