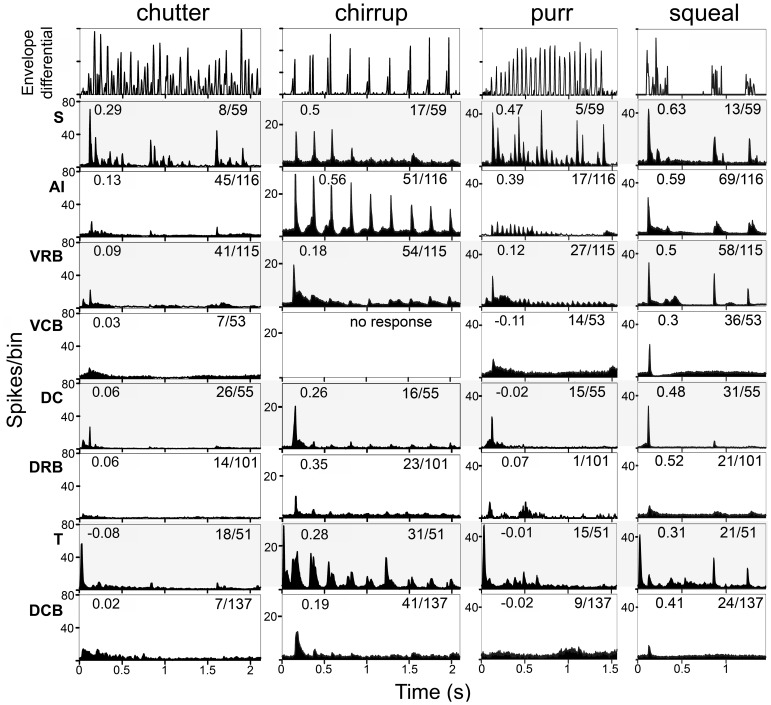
Figure 8. Population responses to four calls by units in each of the eight cortical areas.
The top panel of each column shows the first differential of the waveform envelope. Each subsequent row shows the responses from one cortical area as indicated on the left. The numbers on the left of the response panels show the correlation between the mean population response and the first differential of the envelope in the top panel. The numbers on the right show the proportion of recorded units in each area that responded to the call by an increased firing rate and that were used in forming the population response.

