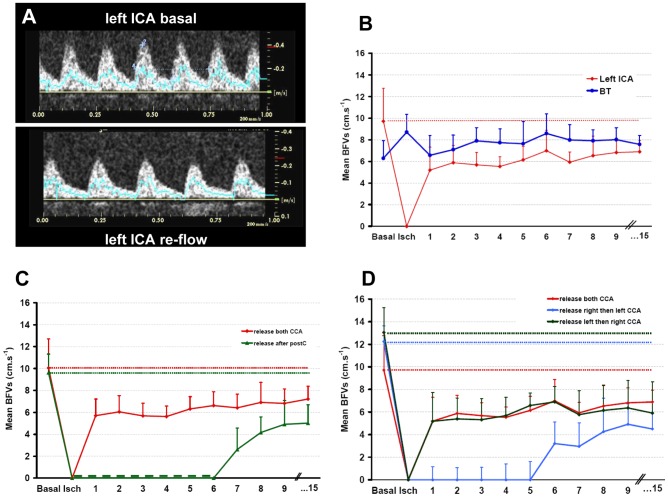
Figure 3. Changes in arterial cerebral blood flow in animals subjected to neonatal ischemia.
A: spectral analyses of blood-flow velocity waveforms acquired with pulsed Doppler in the left ICA before ischemia (basal, left) and at 3 min after re-flow (right). B: Time course of mBFV in the left ICA and in the basilar trunk (BT) during reperfusion. Mean BFVs were plotted before ischemia, during ischemia (at 40 min) and during the first 15 min of the reperfusion. Note that mBFVs in the left ICA at the reperfusion did not reach the level of its mean value in basal condition. In the BT, mBFVs were increased during ischemia (*p<0.05 vs basal) and returned to basal values at the reperfusion. C–D: Time course of mBFV in the left ICA during reperfusion in animals subjected to neonatal ischemia and/or postconditioning. C: Mean BFVs were plotted before ischemia (basal), during ischemia (at 40 min) and during the first 15 min of the reperfusion after release on both CCA (ischemic controls, red line, n = 5), and after 1/1 min postC (3 cycles, green line, n = 6). D: Mean BFVs were plotted before ischemia (basal), during ischemia (at 40 min) and during the first 15 min of the reperfusion after release on both CCA (ischemic controls, red line, n = 6), after release occlusion on left CCA then right CCA 5 min later (green line, n = 5), and after release on the right then left CCA 5 min later (blue line, n = 5). Data are expressed as mean±SD.

