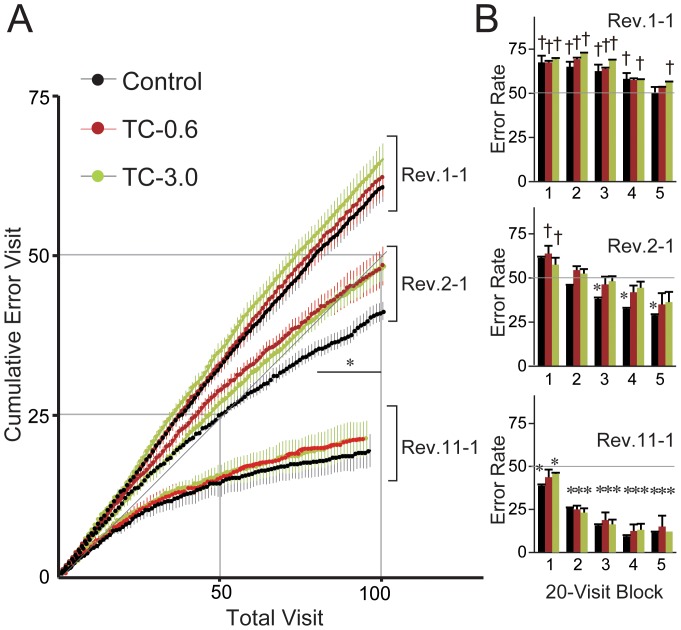
Figure 2. Impaired behavioral flexibility in TCDD-exposed mice (intra-session analysis).
(A) The curves of cumulative error visit (mean ± S.E.M., n = 8/group) in the first sessions of Rev. 1, 2, and 11 (Rev.1-1, Rev.2-1, and Rev.11-1, respectively) of each group are shown. * represents a significantly lower cumulative error visit than chance in the Control group within a range of 80th–100th total visit (P<0.05, repeated ANOVA). (B) Error rates per 20-visit block in Rev. 1-1, Rev. 2-1, and Rev. 11-1 (mean ± S.E.M., n = 8/group). The first 100 corner visits in each session were divided into five blocks (block 1 to 5) and analyzed using factorial ANOVA. The black, red and green bars indicate the data from the Control, TC-0.6, and TC-3.0 groups, respectively. † and * indicate a significantly higher or lower difference from chance (50%, gray line), respectively.

