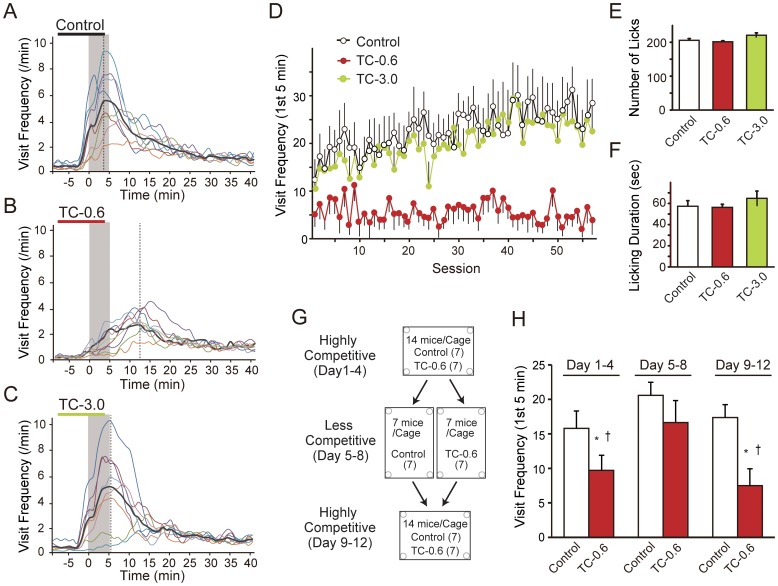
Figure 4. Low competitive dominance in the low TCDD dose (TC-0.6) group.
(A, B, C) Time-course of visit frequency in the first session of the day (21:50–22:40). The gray-colored period indicates the first five minutes (22:00–22:05) of the task. Vertical dotted lines indicate a peak in the group-averaged number of visits. (A, B, C) Time-course of visit frequency at the beginning of the session (21:50–22:40). Colored lines indicate the averaged visit frequency across all the sessions of each mouse, and the black thick lines indicate the average of each group: (A) Control, (B) TC-0.6, and (C) TC-3.0. (D) Visit frequency in the first five minutes throughout the sessions for each group (mean ± S.E.M., n = 8/group). (E, F) Average number of visits and duration of licking per session are shown as indices of daily water consumption. Error bars indicate ± S.E.M., n = 8/group. (G) A diagram of the competition task, in which the Control and TC-0.6 groups of mice (littermates of the mice used in the behavioral flexibility task) were subjected to the same water deprivation schedule as in the behavioral flexibility task. From days 1 to 4, all of the mice (a total of 14 mice, comprised of the Control and TC-0.6 groups) were housed in the same IntelliCage apparatus (a highly competitive condition). From days 5 to 8, each group of mice was housed separately in two different IntelliCage apparatuses (a less competitive condition). From days 9 to 12, all the mice were again housed in the same IntelliCage apparatus (a highly competitive condition). (H) Visit frequency in the first five minutes in the competition task. * and † indicate a significant difference from the Control group in the identical time period and from the TC-0.6 group on days 5 to 8, respectively. Error bars indicate ± S.E.M., n = 7/group.

