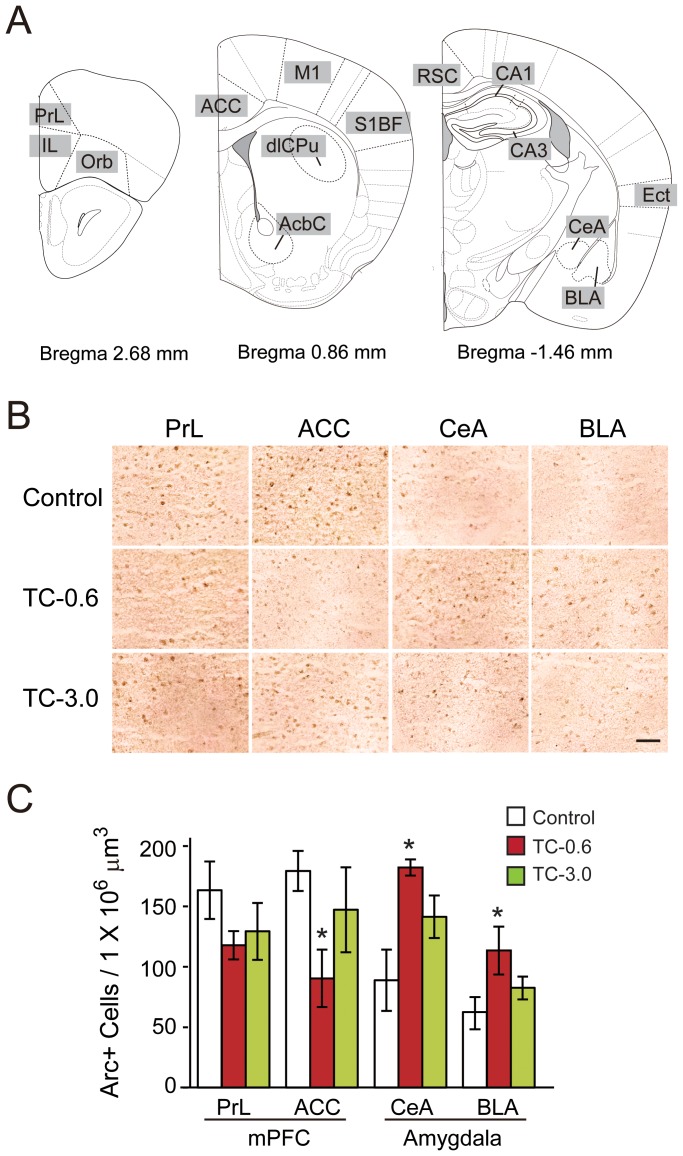
Figure 5. Brain areas associated with TCDD-induced behavioral alterations.
(A) Regions of interest. Illustrations are modified with permission from [54]. (B) Representative photomicrographs of Arc-positive cells in the PrL, ACC, CeA, and BLA. (C) Numbers of Arc-positive cells in each brain area as estimated by stereological analysis. Bars, open, red, and green, indicate the Control, TC-0.6, and TC-3.0 groups of mice, respectively (mean ± S.E.M, n = 5/group). * indicates a significant difference from the Control group. (P<0.05, two-way ANOVA followed by Tukey's post hoc test).

