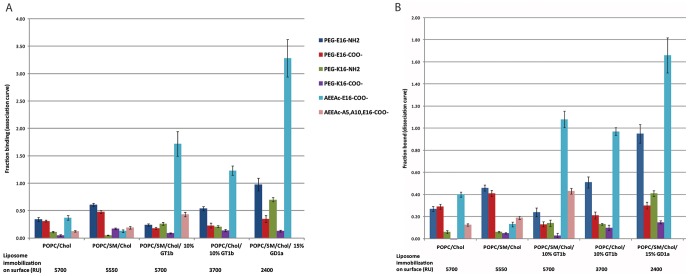
Figure 2. Surface Plasmon Resonance (Biacore) assay of SBD variants' association with immobilized liposomes.
Surfaces with and without sphingolipid and ganglioside consisted of the mixtures listed below the X-axis. (A) Fraction binding on the Y-axis refers to the peak height of the association curve in response units (RU), normalized to the average immobilization level over all flow cells for that experiment, indicated by the numbers (in RU) under the graph. The value for fraction binding was obtained by averaging this normalized peak value for at least three flow cells (see Materials and Methods). (B) Fraction bound on the Y-axis refers to the height of the dissociation curve in RU, normalized to the average over all flow cells for that experiment. The error bars represent the variation in the magnitude of response between flow cells.

