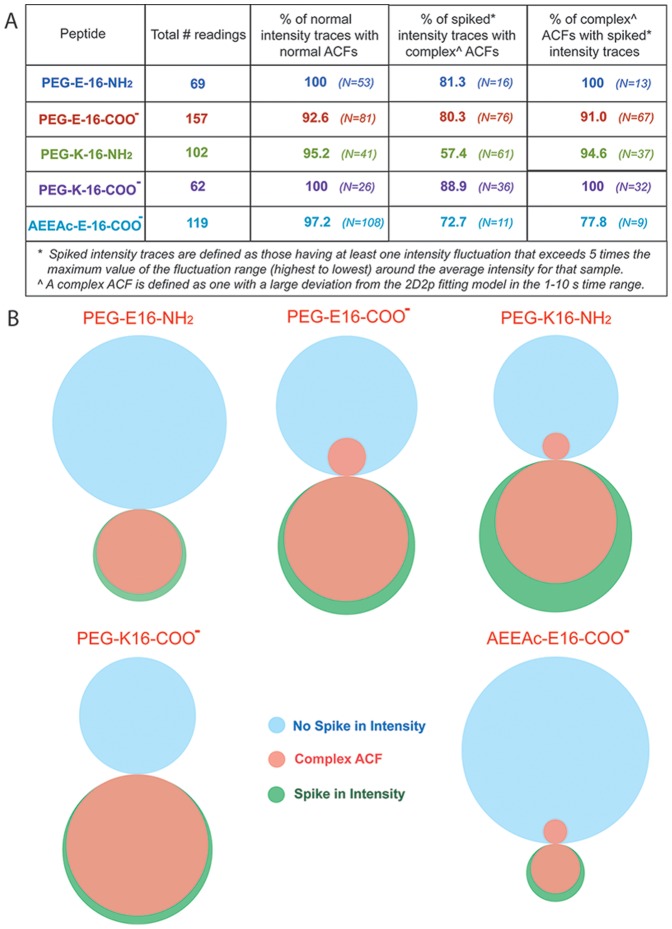
Figure 7. Correlation of aggregation-induced intensity spikes with complex autocorrelation curves in the different SBD variants.
(A) Correspondence of spikes in intensity traces with incidence of non-fitting of the ACF with the 2D,2p model (curves in fig. 4) between 1–10 sec (“complex” ACFs). The number of ACFs and intensity traces observed in each case is given in brackets. For the AEEAc-E16-COO- peptide, the number of spiked intensity traces and complex ACFs was very low compared to the others (n = 9 and 7, respectively). (B) Venn diagrams illustrating the degree of correspondence between readings showing spikes in intensity traces (green circles), vs. those that do not (blue circles) and readings having complex ACFs (beige circles), for each SBD variant. The actual relative proportions of readings in each category, as well as the proportion of readings that were shared between categories, are represented by the relative sizes of the circles and overlaps.

