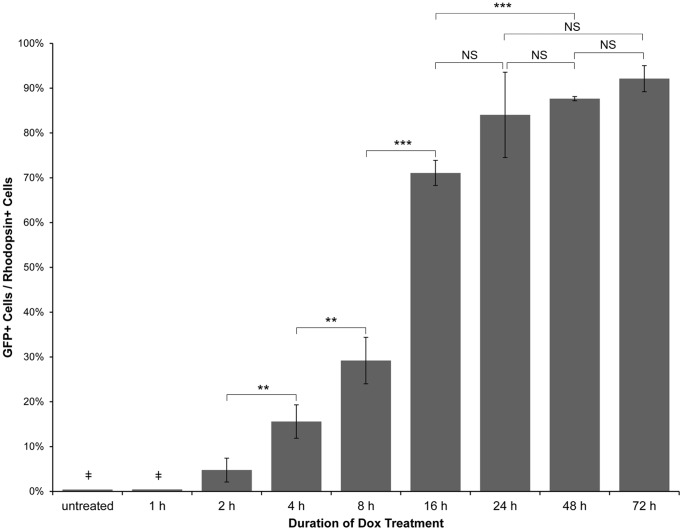
Figure 3. Quantitative analysis of the time course of doxycycline-induced GFP expression in Tg(Xla.rho:rtTA, TRE:GFP) larvae.
Tg(Xla.rho:rtTA, TRE:GFP); alb−/− embryos were reared to 6 dpf. Larvae were treated with 10 µg/mL doxycycline (Dox) for the durations indicated prior to fixation at 6 dpf. Fixed larval tissues were processed for cryosectioning and immunofluorescence with antibodies against GFP and Rhodopsin. GFP-positive and Rhodopsin-positive rod outer segments were counted and averaged amongst 3 confocal z-projections for each of the 2–72 h treatment groups. The ratio of GFP-positive to Rhodopsin-positive cells is plotted for each treatment group; error bars represent standard deviation. ( ) The untreated and 1 h Dox-treated samples were quantified by counting the number of GFP-positive cells in all retinal sections from 10 eyes and dividing by an estimation of the total number of rods per eye. Statistical comparisons are indicated by brackets. ***, p<0.001; **, p<0.01; NS, not significant.

