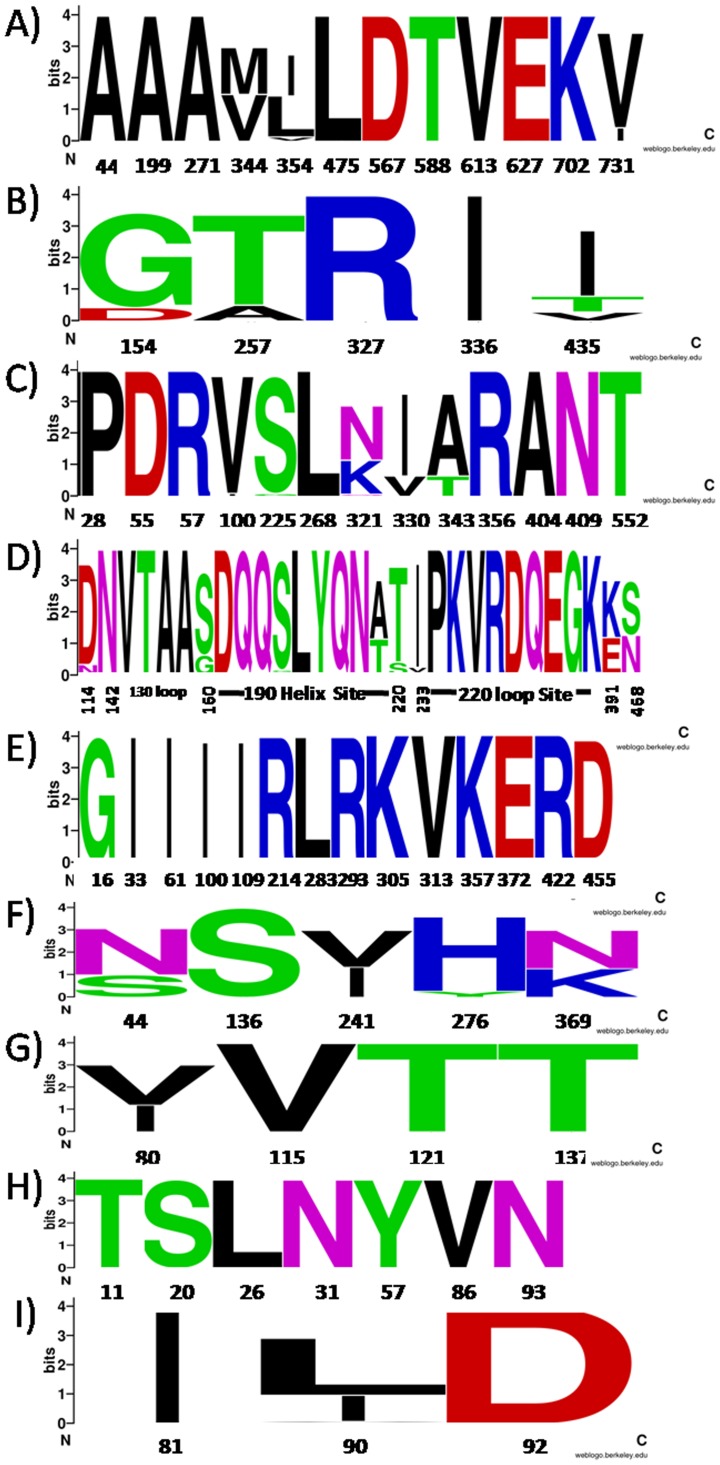
Figure 3. Genome signatures in amino acid residues of human pandemic H1N1 in Thailand during 2009–2011 in gene; A) PB2, B) PB1, C) PA, D) HA, E) NP, F) NA, G) M1, H) M2 and I) NS.
The graphical presentation was constructed using WebLogo. The height of symbol indicates the relative frequency of the corresponding amino acid at that position. Residue positions are given based on the nucleotide positions of each gene.

