
Figure 2. Changes in weight of ferrets over the course of infection with A/Cal.
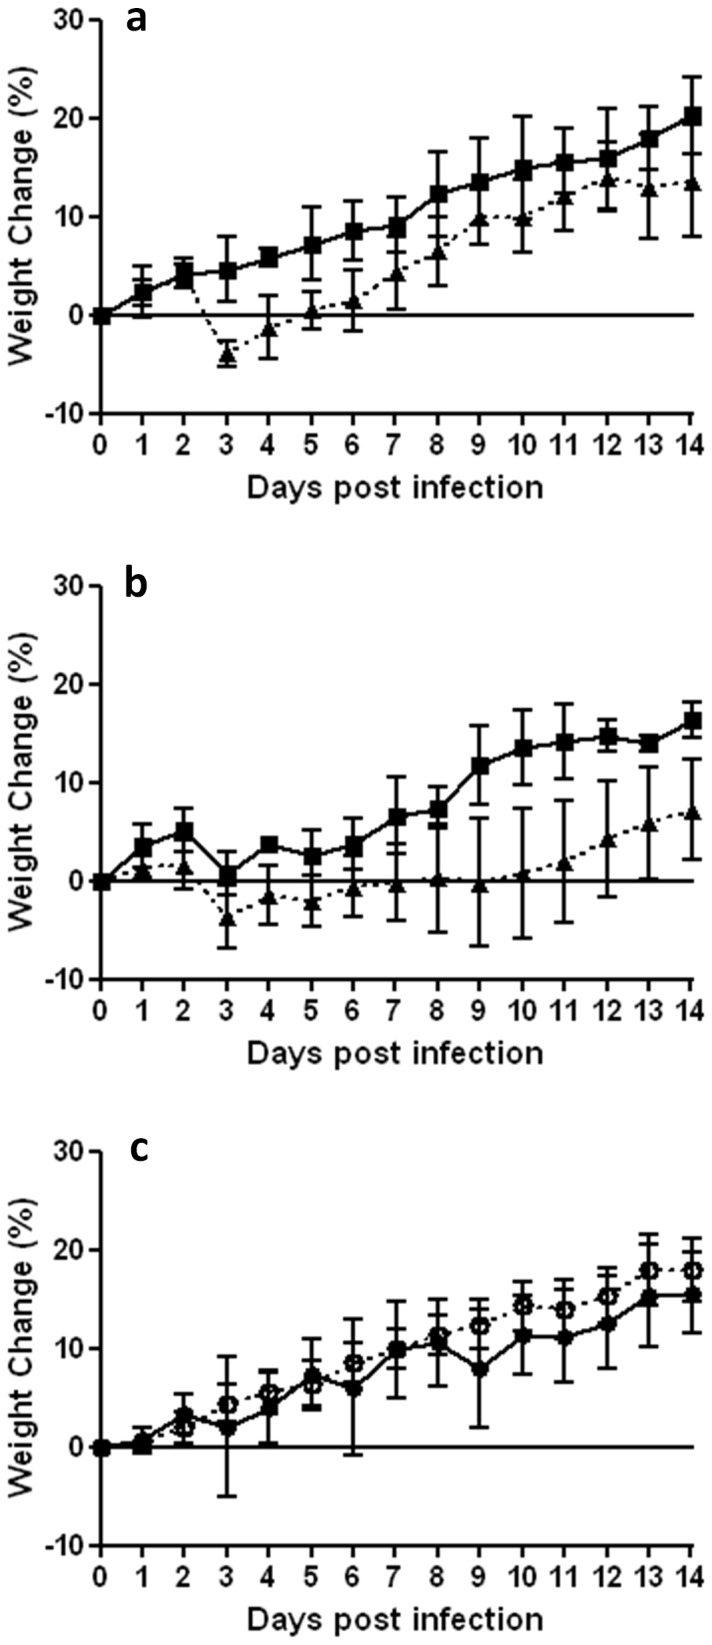
Shown is the mean group body weight changes in A/Cal influenza virus-infected ferrets treated with (a) 300 µg 244 DI virus (▪) or inactivated 244 DI virus (▴), (b) 30 µg 244 DI virus (▪) or inactivated 244 DI virus (▴). (c) Shows the weight changes in ferrets inoculated with saline (○) or treated with 300 µg of active 244 DI virus (•). Data are expressed as a percentage change compared to the group average weight at day 0. The statistical significance of body weight changes on any one day was determined by a one tailed unpaired t-test and is indicated by an asterisk (p≤0.05).