
Figure 6. Statistical analysis of summed clinical signs for each day in ferrets re-challenged with A/Cal.
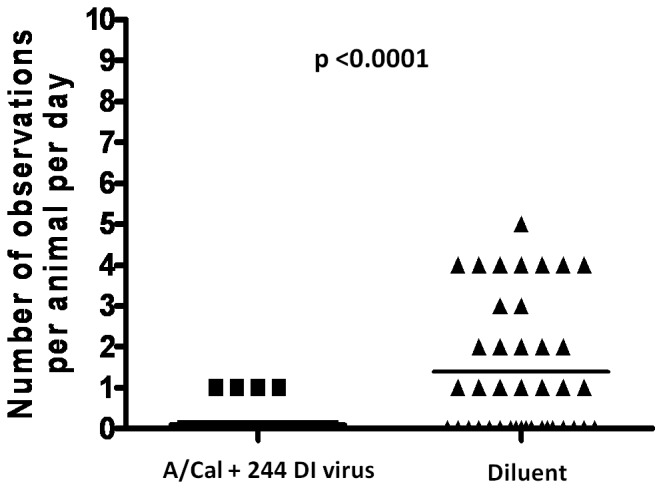
The group that previously experienced A/Cal+300 ug 244 DI virus (▪) is compared with the group that previously experienced only saline (▴). The p value was determined using a one tailed Mann-Whitney U test.