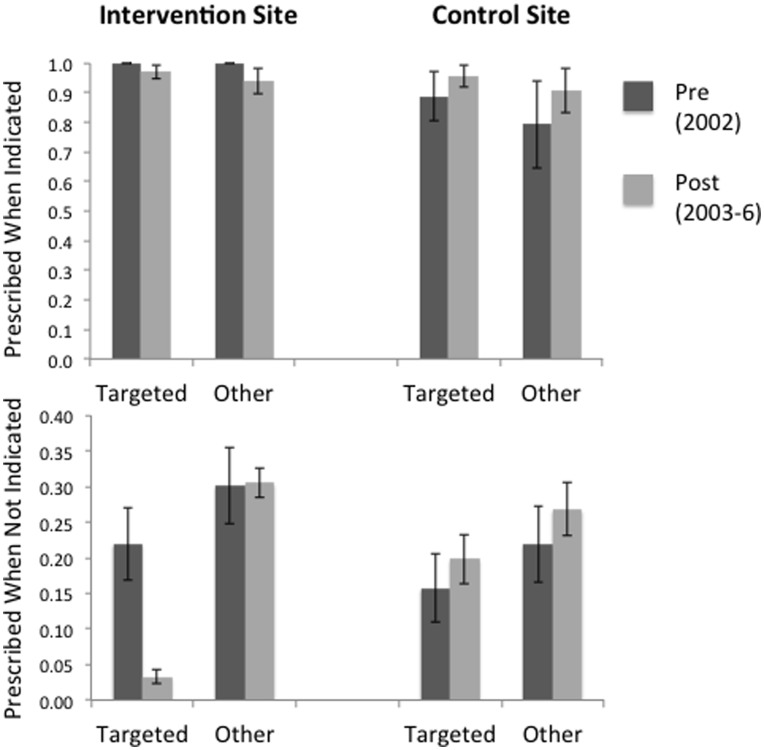
Figure 1. Effect of the CDSS on antibiotics use for ARI.
Comparison of antibiotic utilization for ARI between the time periods before (dark bars) or after (light bars) introduction of the CDSS. Y-axis represents proportions of ARI visit where antibiotics were prescribed. For comparisons involving antibiotics targeted by the CDSS (dark and light bar pairs over the word “Targeted”), proportions are given by VTargeted/(VTargeted+VNoAntibiotic), where VTargeted is the number of visits where targeted antibiotics were prescribed and VNoAntibiotic the number of visits not issued antibiotics. For comparisons involving other antibiotics (dark and light bar pairs over the word “Other”), proportions are given by VOther/(VOther+VNoAntibiotic), where VOther is the number of visits where Other antibiotics were prescribed. Upper panel only includes ARI visits where antibiotics were indicated; lower panel only includes those ARI visits where antibiotics were not indicated. Results for the intervention and the control sites are given on the left and right side of the figure, respectively. Note that proportions of visits where antibiotics were prescribed did not change pre vs. post-intervention, except for a decrease in Targeted antibiotics use at the intervention site.

