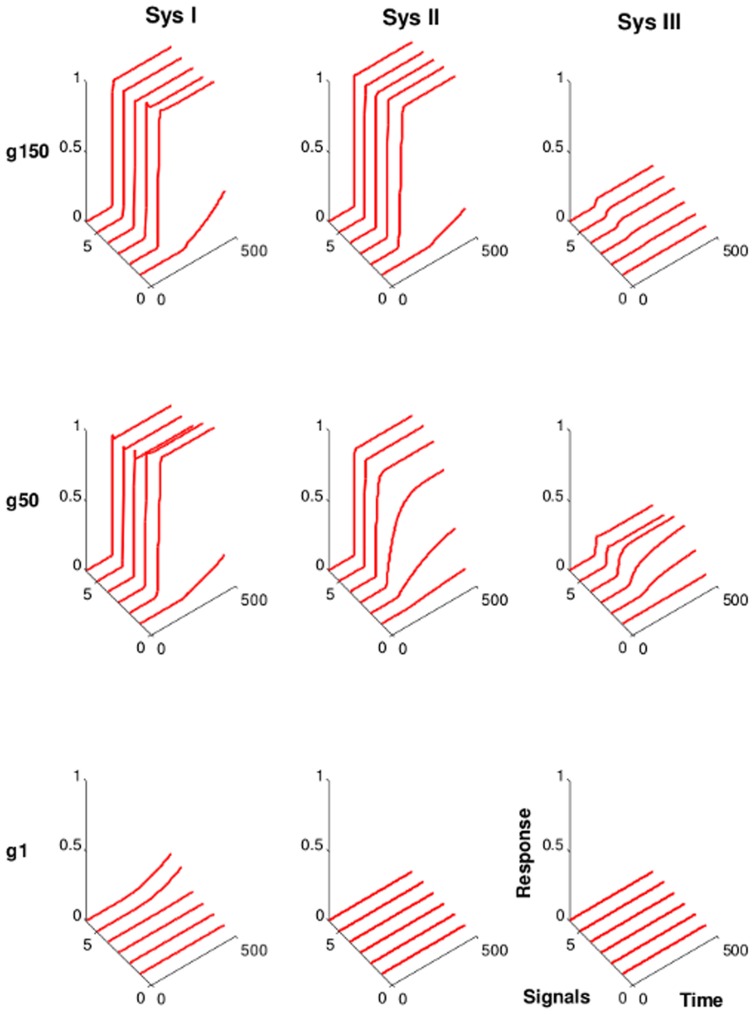
Figure 4. Kinetics of the evolved networks.
Shown are the networks with the highest fitness score from one of the simulation runs.  ,
,  , and
, and  denote the generation
  ,
,  , and
, and  , respectively. The six solid lines show the kinetics of activation of the output node in response to six different input signal strengths (strength increases with signal index). Signals are provided at time
  . Sys I, weak interactions (
 ). Sys II, moderate interactions (
 ). Sys III, strong interactions (
 ).
).

