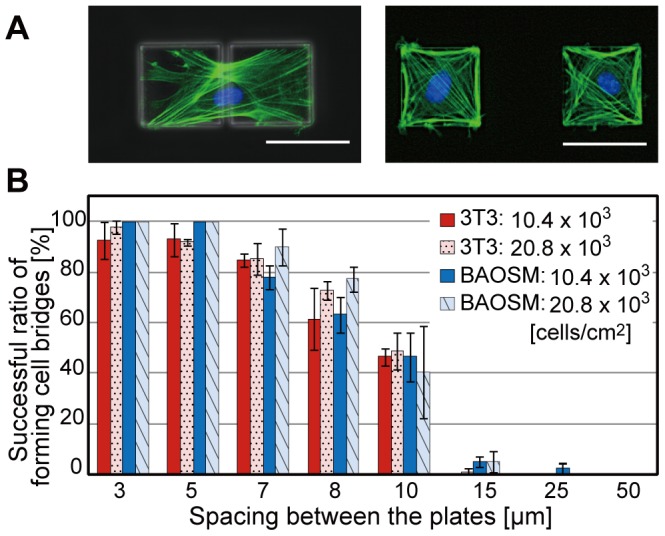
Figure 3. Construction of a cell bridge between a set of two microplates.

(A) Fluorescent images merged with phase contrast images of BAOSMCs on a set of two microplates with spacing of 5 µm (top image) and 50 µm (bottom image). The actin filaments and nuclei of the patterned cells on the microplates are fluorescently stained green and blue, respectively. (B) A graph of the ratio of successfully-formed cells bridge between the two microplates against various plate spacing, different concentrations of the cultured cells, and two different cell types. Results are shown as the mean ± s.d. (n = 3–10: 100 samples were observed each experiment). Scale bars, 50 µm.
