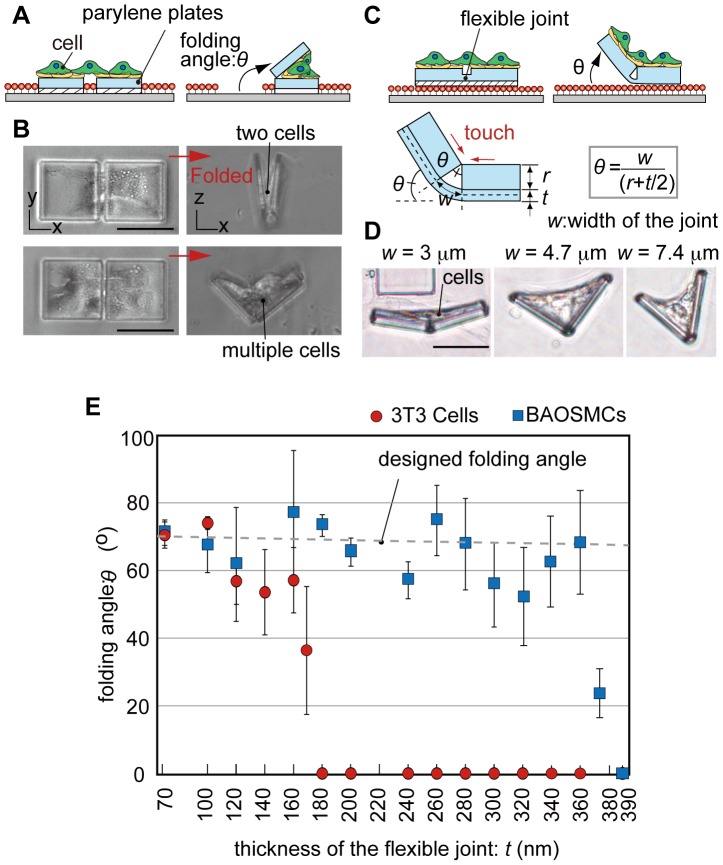
Figure 4. Characterization of the folding angles.
(A) Schematic illustration of folding parylene microplates without a flexible joint. The plates are folded until the microplates are blocked by the cells. (B) Phase contrast images before and after folding of the microplates without the joint having different cell density of NIH/3T3 cells. (C) Schematic illustration of folding microplates with a flexible joint. The folding angle, θ, is defined as the angle between the folded microplates and the glass substrate. The plates are folded until the edges of the plates contact each other. (D) Phase contrast images after folding parylene microplates with different w of the flexible joint. Different θ are achieved by changing the value of w using BAOSMCs. (E) The relationship between θ and t for NIH/3T3 cells and BAOSMCs when w = 4.68 µm, w = 3.8 µm. Results are shown as the mean ± s.d. (n = 3–14: 100 samples were measured each experiment). Scale bars, 50 µm.

