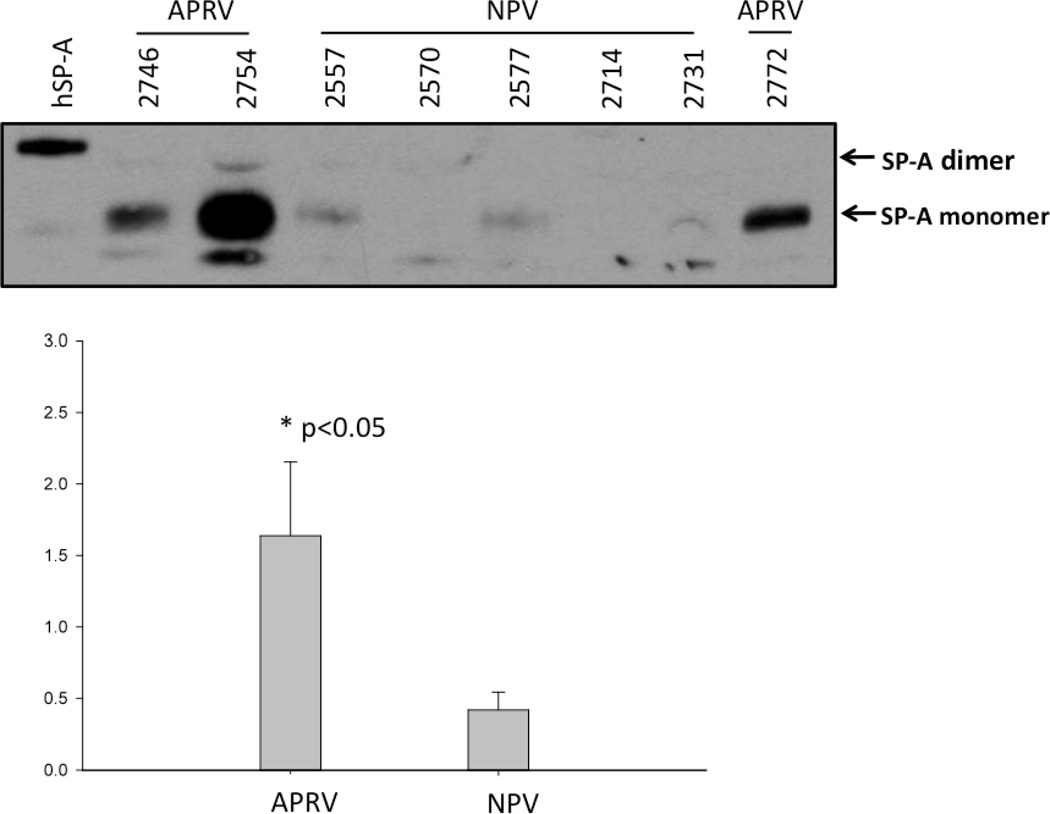
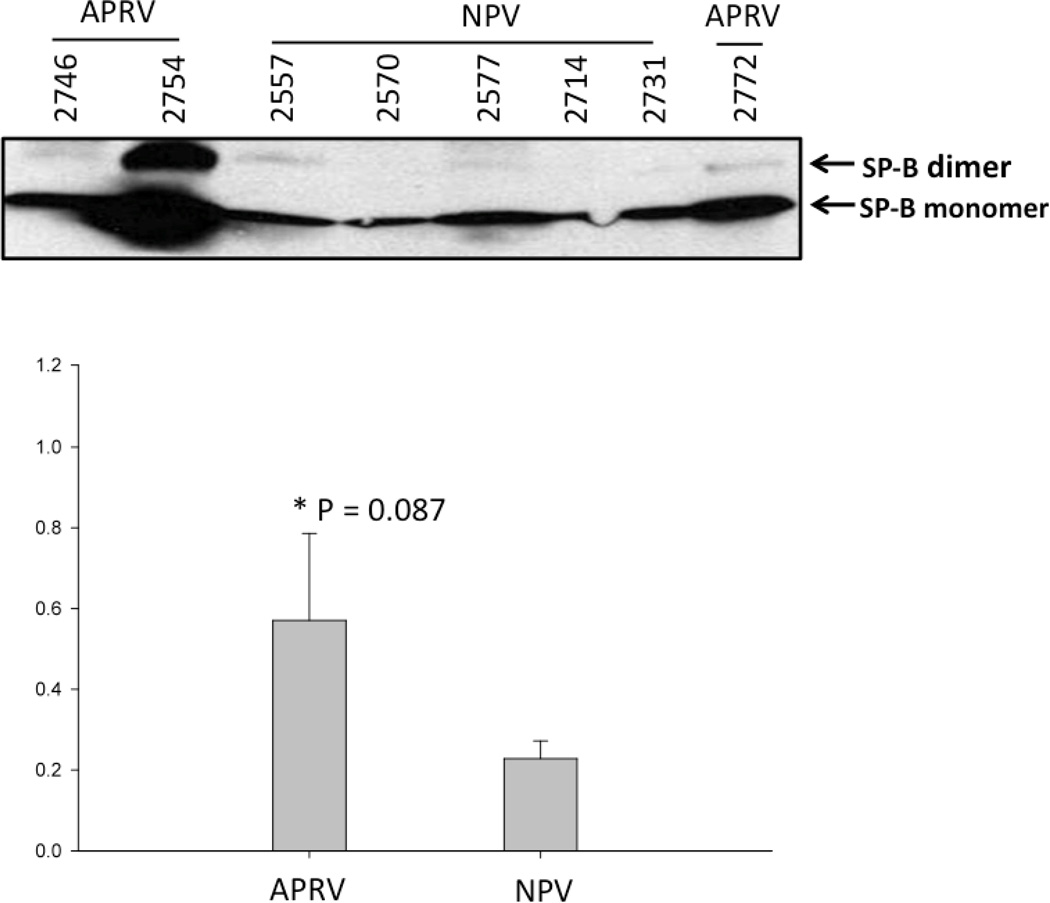
Figure 3.
a & b. Western Blot of Surfactant Protein A and B in BALF Each animal is labeled by treatment group (APRV vs NPV). Figure 3a shows that APRV preserved Surfactant Protein A abundance relative to NPV (*=p<0.05).
b shows SP-B protein expression in the BAL fluid from NPV was markedly lower compared with APRV however this was not statistically significant (p=0.08).


