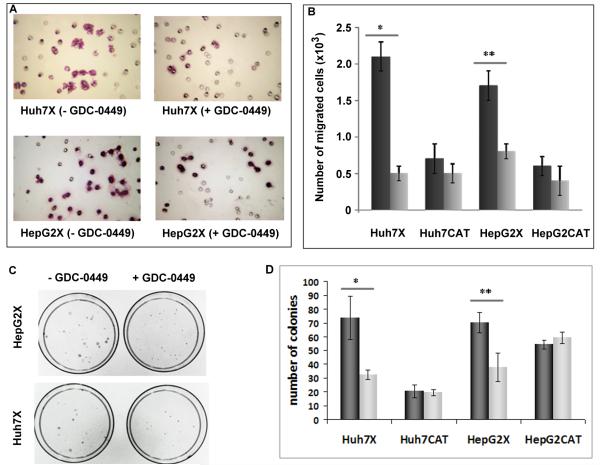
Fig. 2.
Phenotypic changes associated with Hh signaling in HBx positive and negative cells with or without GDC-0449. (A) Representative images of HBx expressing cells that migrated through Matrigel basement membrane (200x). (B) Quantification of the results in panel A (mean expression ± S.D. of 3 assays). Cells were treated with DMSO (dark bars) or with GDC-0449 (light bars): *p<0.01; **p<0.02. (C) Anchorage independent growth of Huh7X and HepG2X with or without GDC-0449. (D) Quantification of the results in panel C (mean expression ± S.D. of 3 assays). Cells were treated with DMSO (dark bars) or with GDC-0449 (light bars): *p<0.01; **p<0.03.

