Fig. 7.
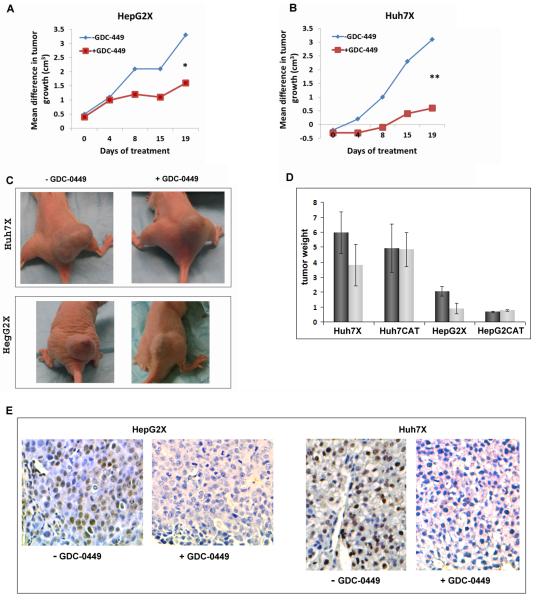
HBx expressing xenografts in nude mice treated with vehicle or GDC-0449. The mean difference in tumor size for (A) HepG2X and (B) Huh7X tumors (to evaluate the contribution of HBx only) was calculated as follows: the average size of HepG2CAT tumors without drug was subtracted from the average size of HepG2X tumors without drug and plotted for each time point. Likewise, the average size of HepG2CAT cells with drug was subtracted from the average size of the HepG2X tumors with drug. Parallel calculations were performed for Huh7 cells; *p < 0.01; **p < 0.005 at day 19. (C) Nude mice with Huh7X and HepG2X xenografts following treatment with GDC-0449 or vehicle. (D) Mean wet weights (in grams) of tumors from HBx positive and negative HepG2 and Huh7 xenografts in animals treated with drug or vehicle; *p < 0.01; **p < 0.05. (E) IHC staining for Gli2 in Huh7X and HepG2X xenografts after treatment with GDC-0449 or vehicle.

