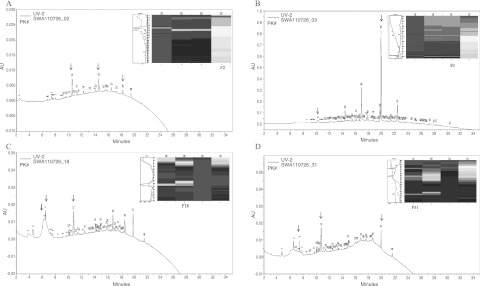
Fig. 3.
Second dimensional elution profile of 1-D fractions 2 (A), 3 (B), 18 (C) and 31 (D). 1-D fractions were run in the 2-D reversed phase chromatography using the ProteomeLab PF 2D. As shown is the elution profile with respect to time and absorbance units (AU). The elution gradient was achieved using two solvents, 0.1% TFA in water (A) and 0.08% TFA in ACN (B). The 2-D fractionation was run at column temperature of 50°C and a buffer flow rate of 0.75 ml/min with the absorption monitored at 214 nm. The column was eluted with a 0–100% linear gradient of solvent A and B for 35 min. Insert, 2-D UV difference maps obtained by ProteoVue of the fractions and the pH range; 31 (pH 4.29–4.34), 18 (pH 6.03–6.33), 3 (pH 8.22–8.45) and 2 (pH 8.45–8.47). Arrows indicate fractions from which proteins were sequenced. F2 P# = 14, 23, 29. F3 P# = 14, 23, 29. F18 P# = 3/4, 13. F31 P# = 6, 16, 47. P#, peak numbers.

