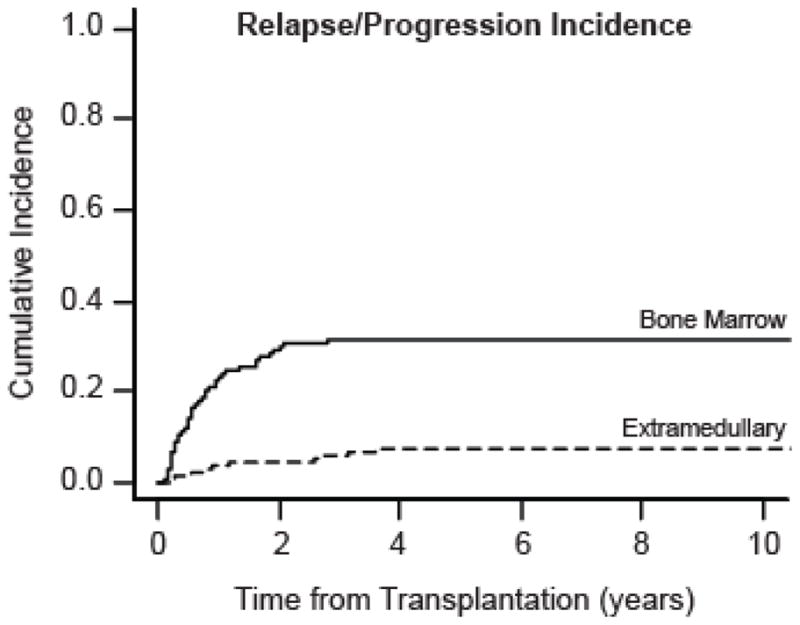
Figure 1. Cumulative Incidence of Relapse/Progression.

The cumulative incidence curves for bone marrow relapse/progression (n=76, solid line) and extramedullary relapse/progression (n=18, dashed line) are plotted from the date of transplantation (in years). The 18 extramedullary relapses include 5 patients with concurrent bone marrow relapse. Curves were calculated using non-relapse mortality as a competing risk.
