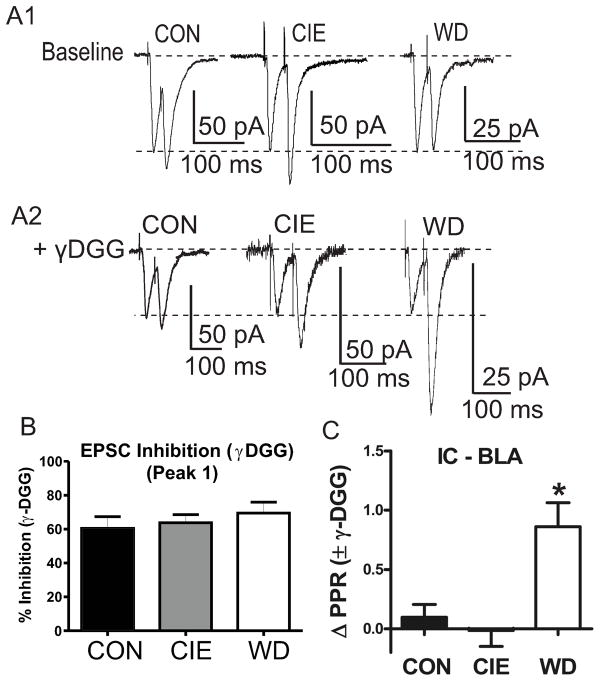
Figure 3. WD increases synaptic glutamate concentration.
A1) Representative traces of baseline paired pulse stimulation (25 ms) across treatment conditions. Traces are scaled to first response amplitudes in all cases. A2) Representative traces following bath application of γDGG (1.0 mM) illustrate decreased second pulse inhibition by γDGG during WD. B) Inhibition of first-response amplitude by γDGG was not different across treatment groups [CON 60.49 ± 6.81%, n =7; CIE, 63.70 ± 4.82, n = 10; WD, 69.48 ± 6.49, n =7; F(2,21) = .052; p > 0.05]. C) WD slices exhibit significantly greater PPR values following bath application of γDGG due to decreased pulse to pulse inhibition [ΔPPR; CON 0.09 ± 0.10, n = 7; CIE, −0.01 ± 0.13, n = 10; WD, 0.86 ± 0.20, n = 7; F(2,21) = 9.475, p < 0.05 Newman Keuls Post Hoc Test * = significant from CON and CIE].

